Know your application users
Learn how users interact with your application and improve it
What is Microsoft Clarity?
Microsoft Clarity is a free user behaviour analytics tool designed to help you understand how people interact with your website. Here’s a concise summary:
Heatmaps: Clarity generates heatmaps that reveal where users click, what they ignore, and how far they scroll on your site.
Session Recordings: You can watch session replays to see real user interactions.
Integration: It seamlessly integrates with Google Analytics and other tools.
Free Forever: Clarity offers all its features at zero cost, with no traffic limits or forced upgrades.
In essence, Clarity empowers you to enhance your products by gaining valuable insights into user behaviour. 🚀 🔍
Installation
Go to https://clarity.microsoft.com/ - Get Started
Create account / Login
Create new Project
Select Website as type
Add Name for your project
Add Website URL (the URL of your APEX application)
Select Install manually (and click on
Get Tracking Codebutton)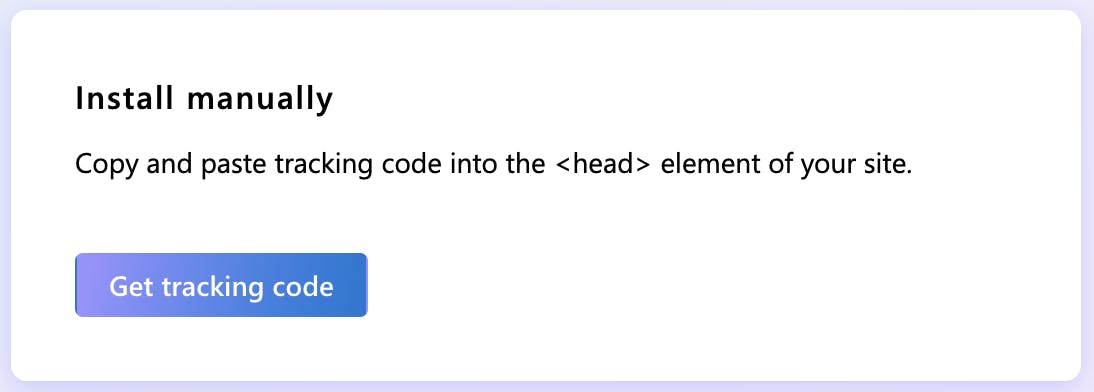
Copy the script to your clipboard and paste it into the head of your APEX page.

If you want it included everywhere in your app, add this code through
Shared Components/Application Definition/User Interface/JavaScriptafter you have first saved the code as a .js file inStatic ApplicationorWorkspacefiles.
Analysing the results
Time to analyze the usage results. Go to Clarity's console and select your Project. You have a Dashboard, Recordings and a Heatmap as features. Here are some more details about each of them.
Recordings
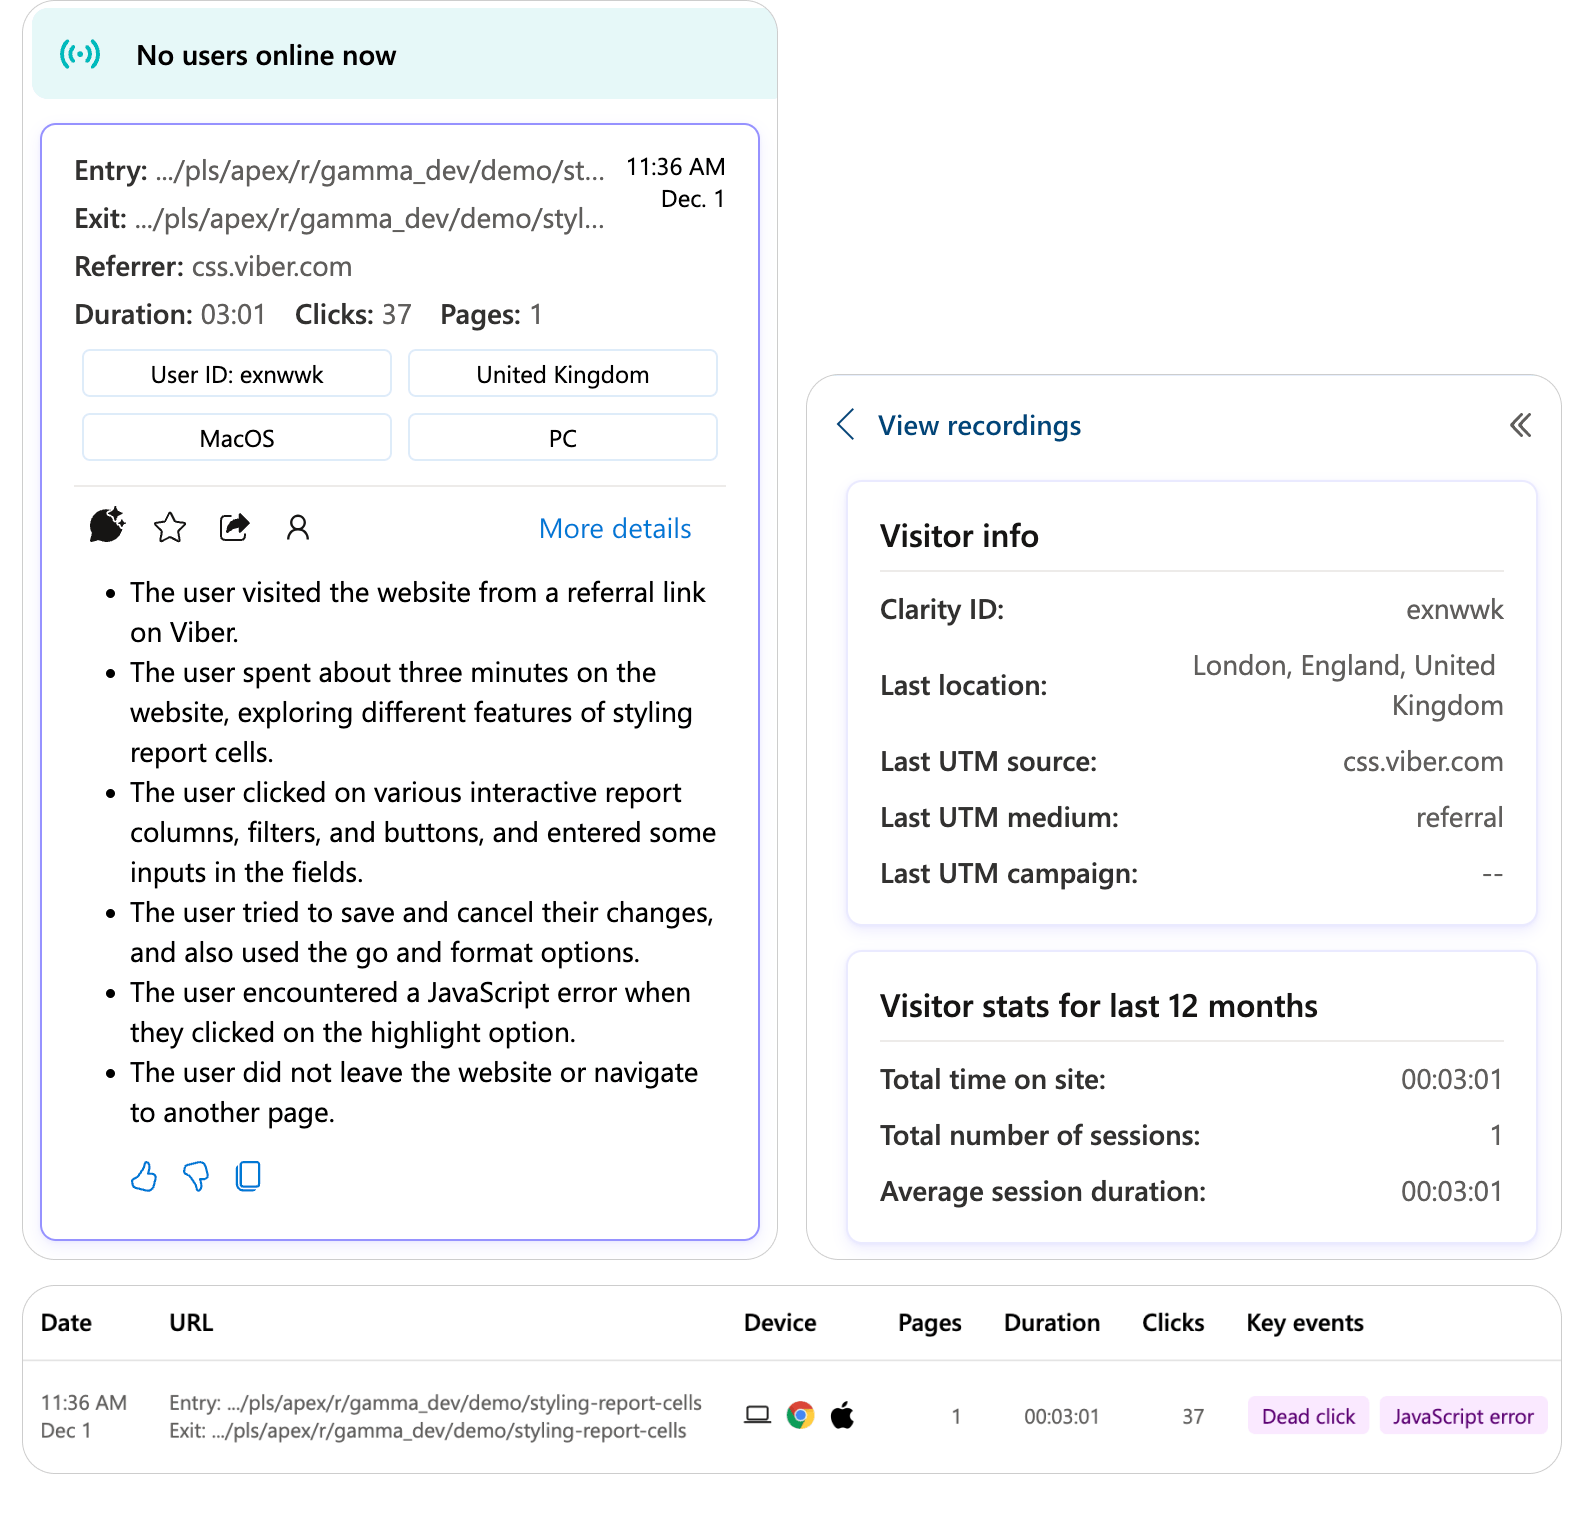
You get a video recording of a user session.
Each click is recorded too.
You have the
liveoption to see almost real-time users actions on the page.Each user gets a unique User_id
There is an AI summary option, quite impressive, giving you details about the user actions if you don't have time to watch the full recording.
Heatmaps
Heatmaps can be three different types:

By the place, users have clicked with the mouse
By the use of the scroll on the page
By particular areas on your page
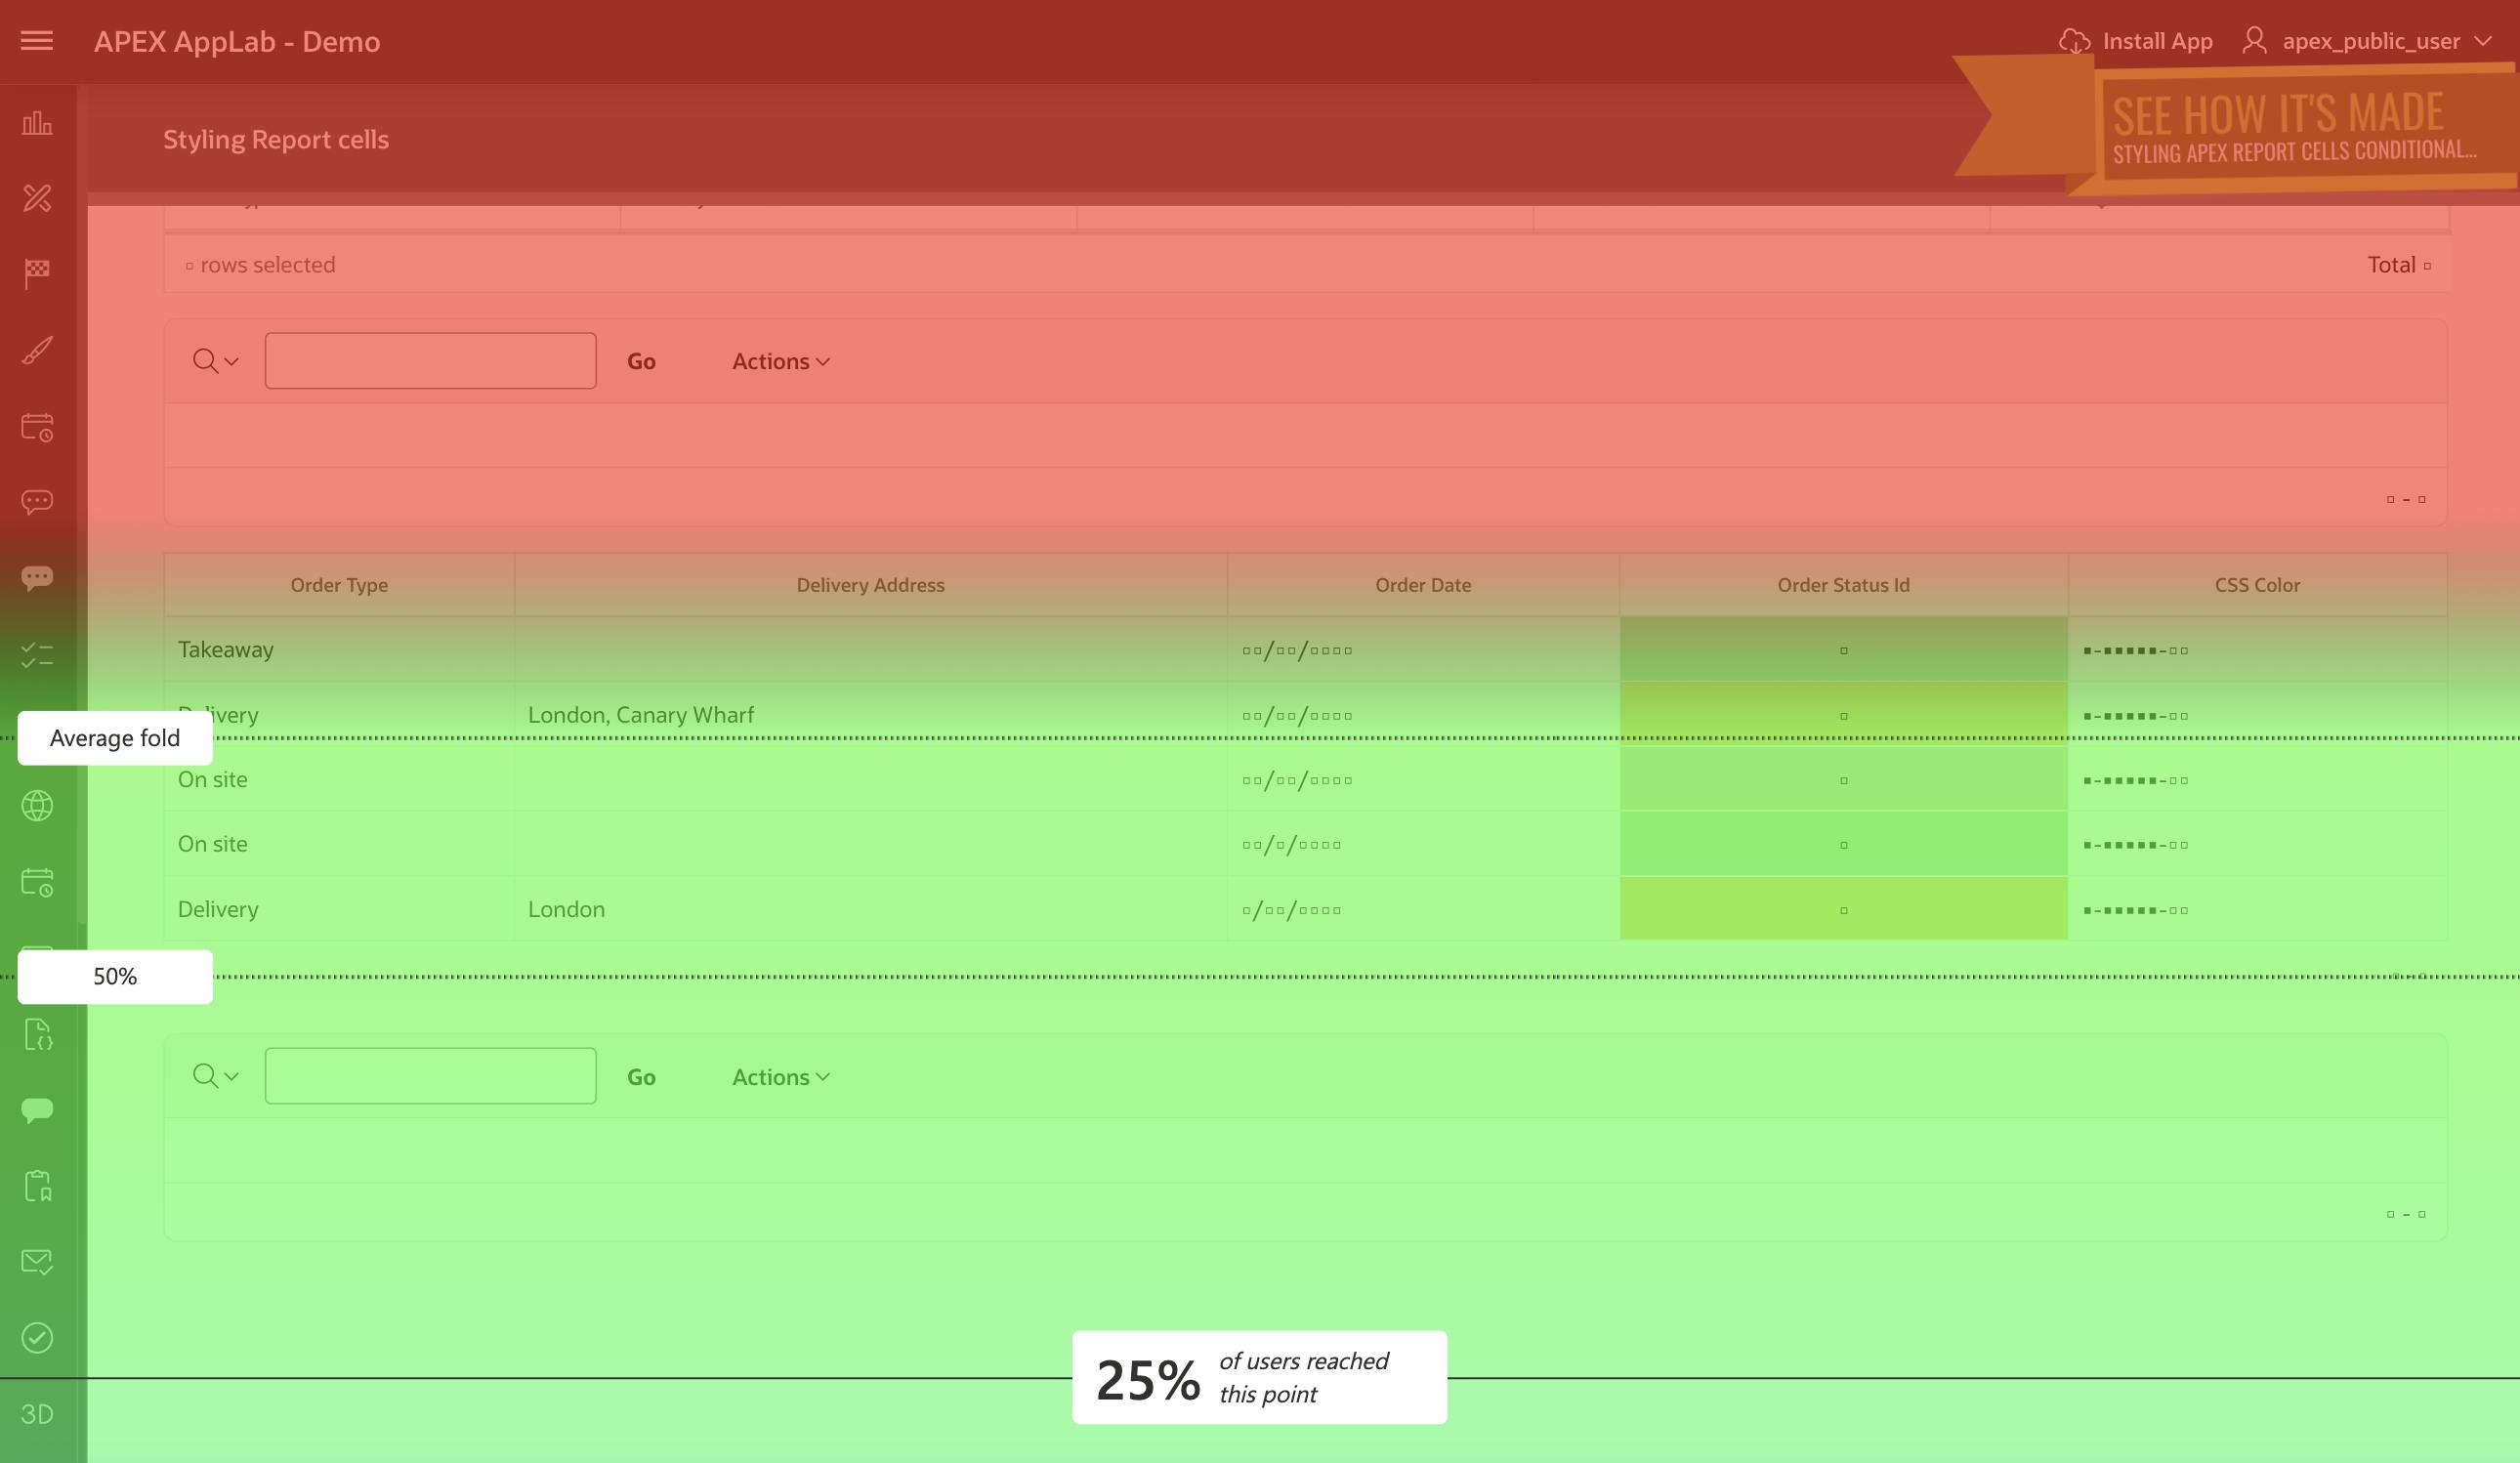
In all 3 cases, the heatmap follows this colouring pattern:

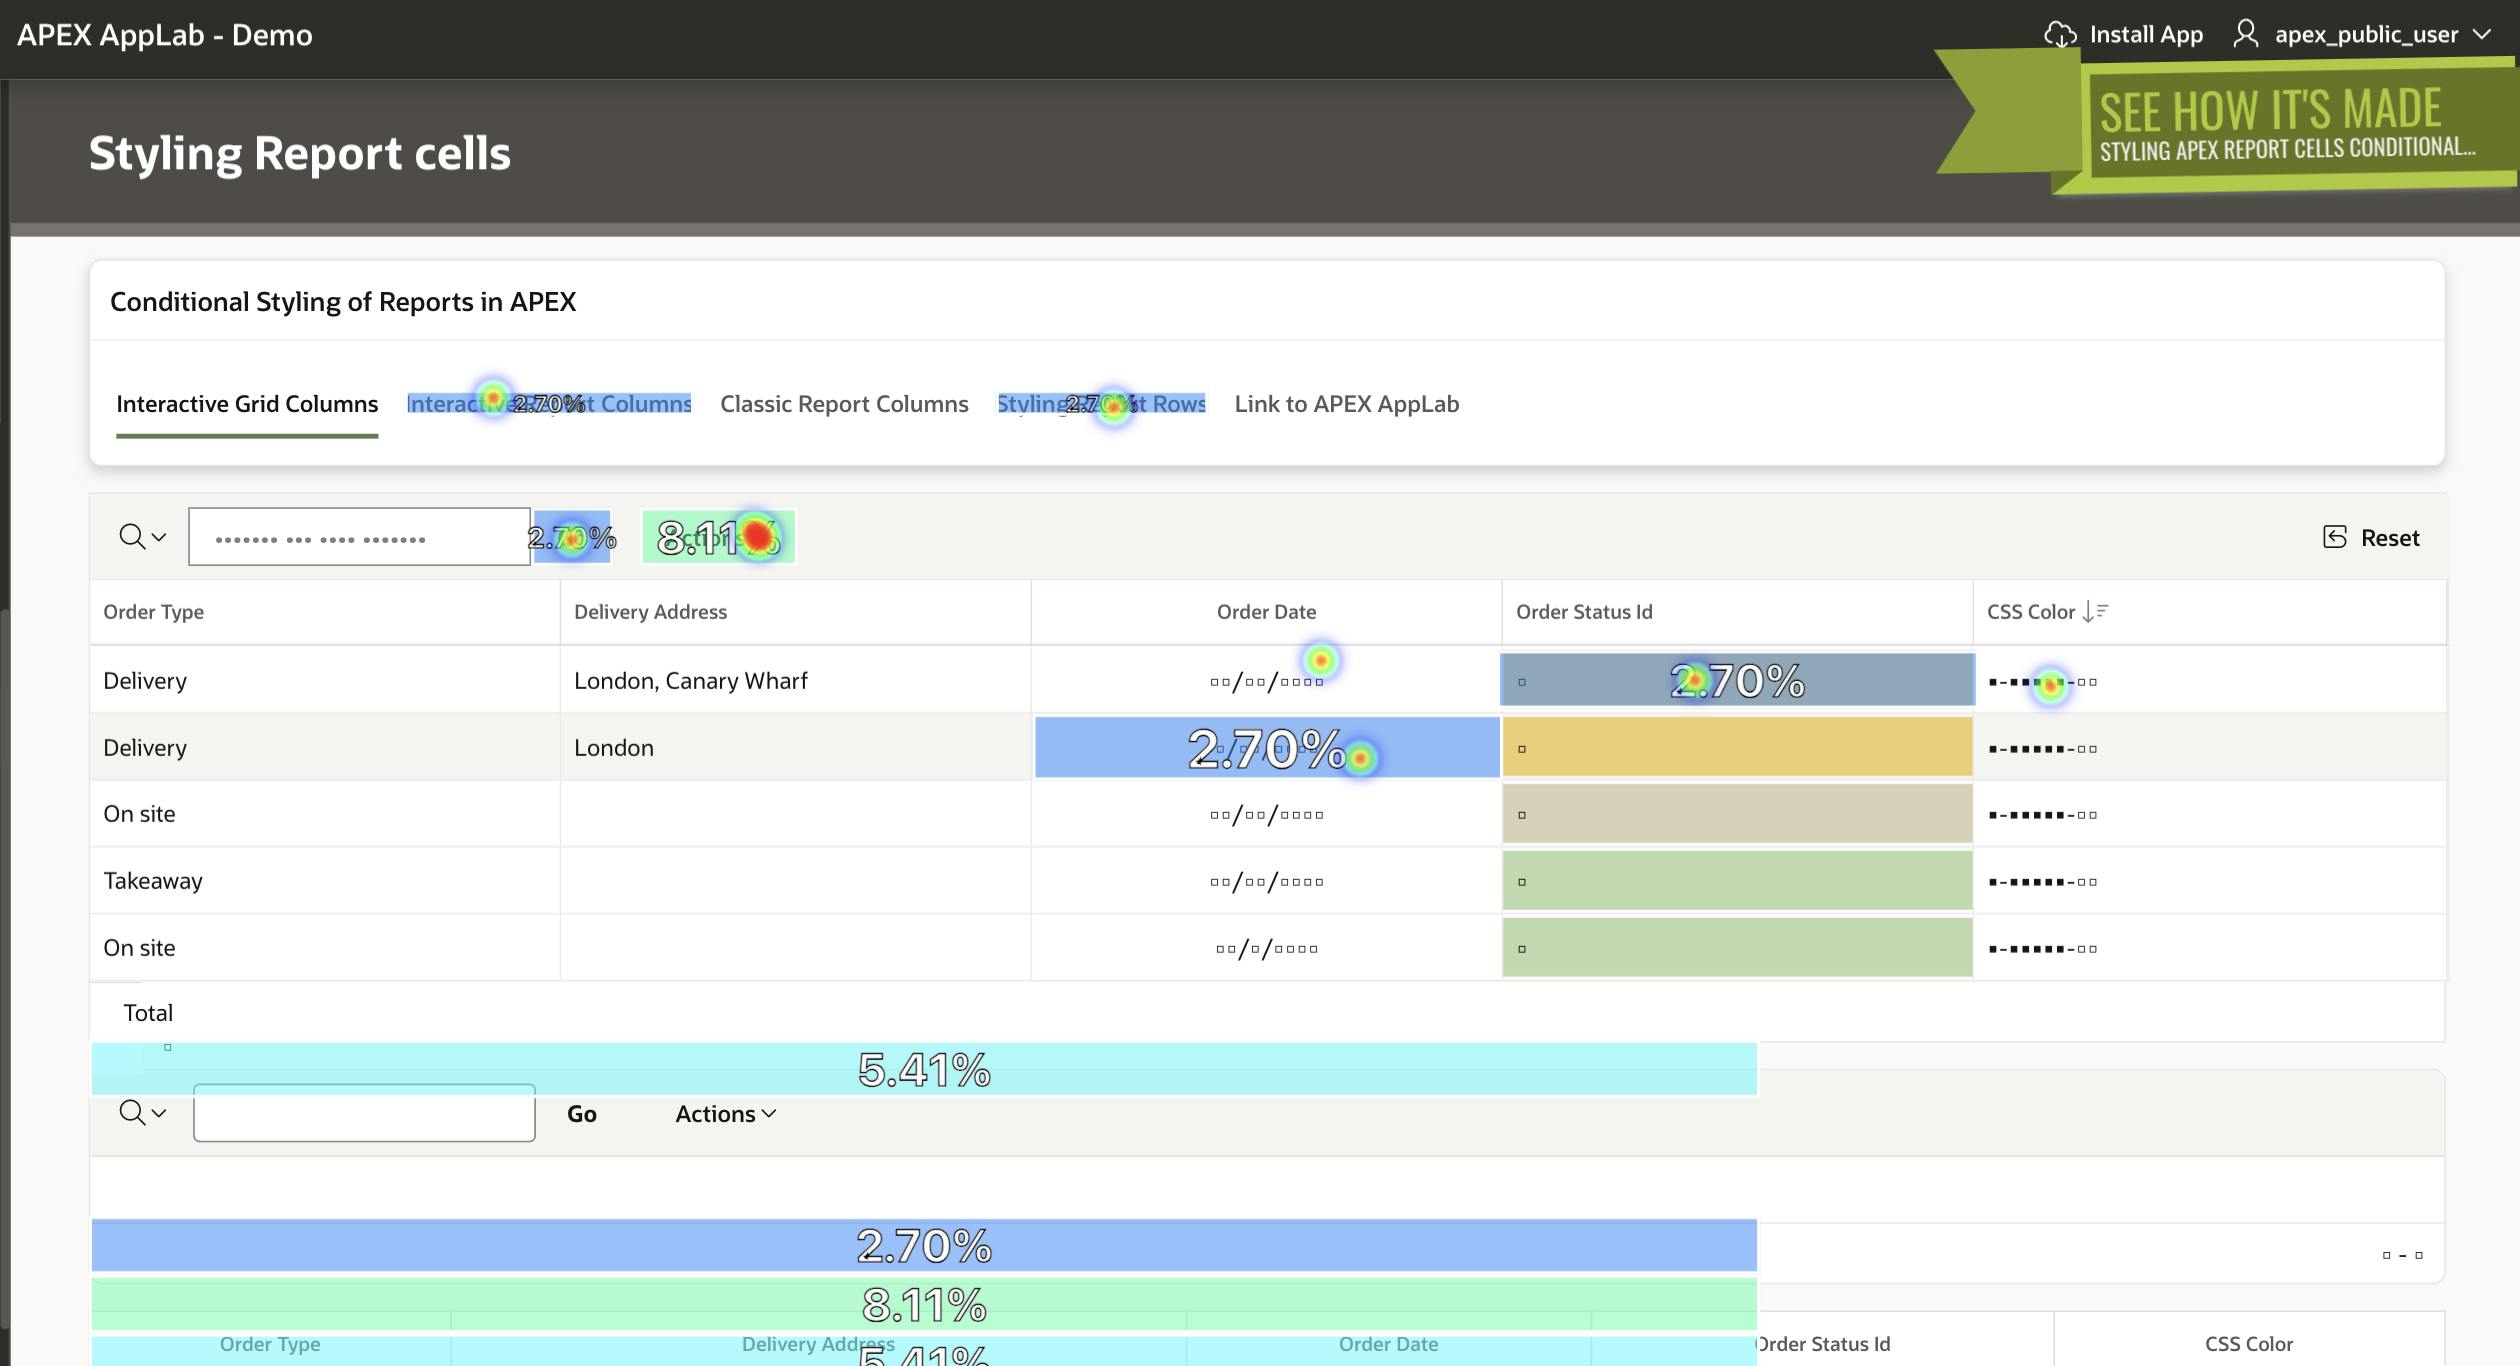
User Attention by area of the web page and heatmaps of user clicks - more clicks in a region means a darker colour on the heatmap. It also can display the order in which each mouse click has happened and the total number of clicks in certain areas.
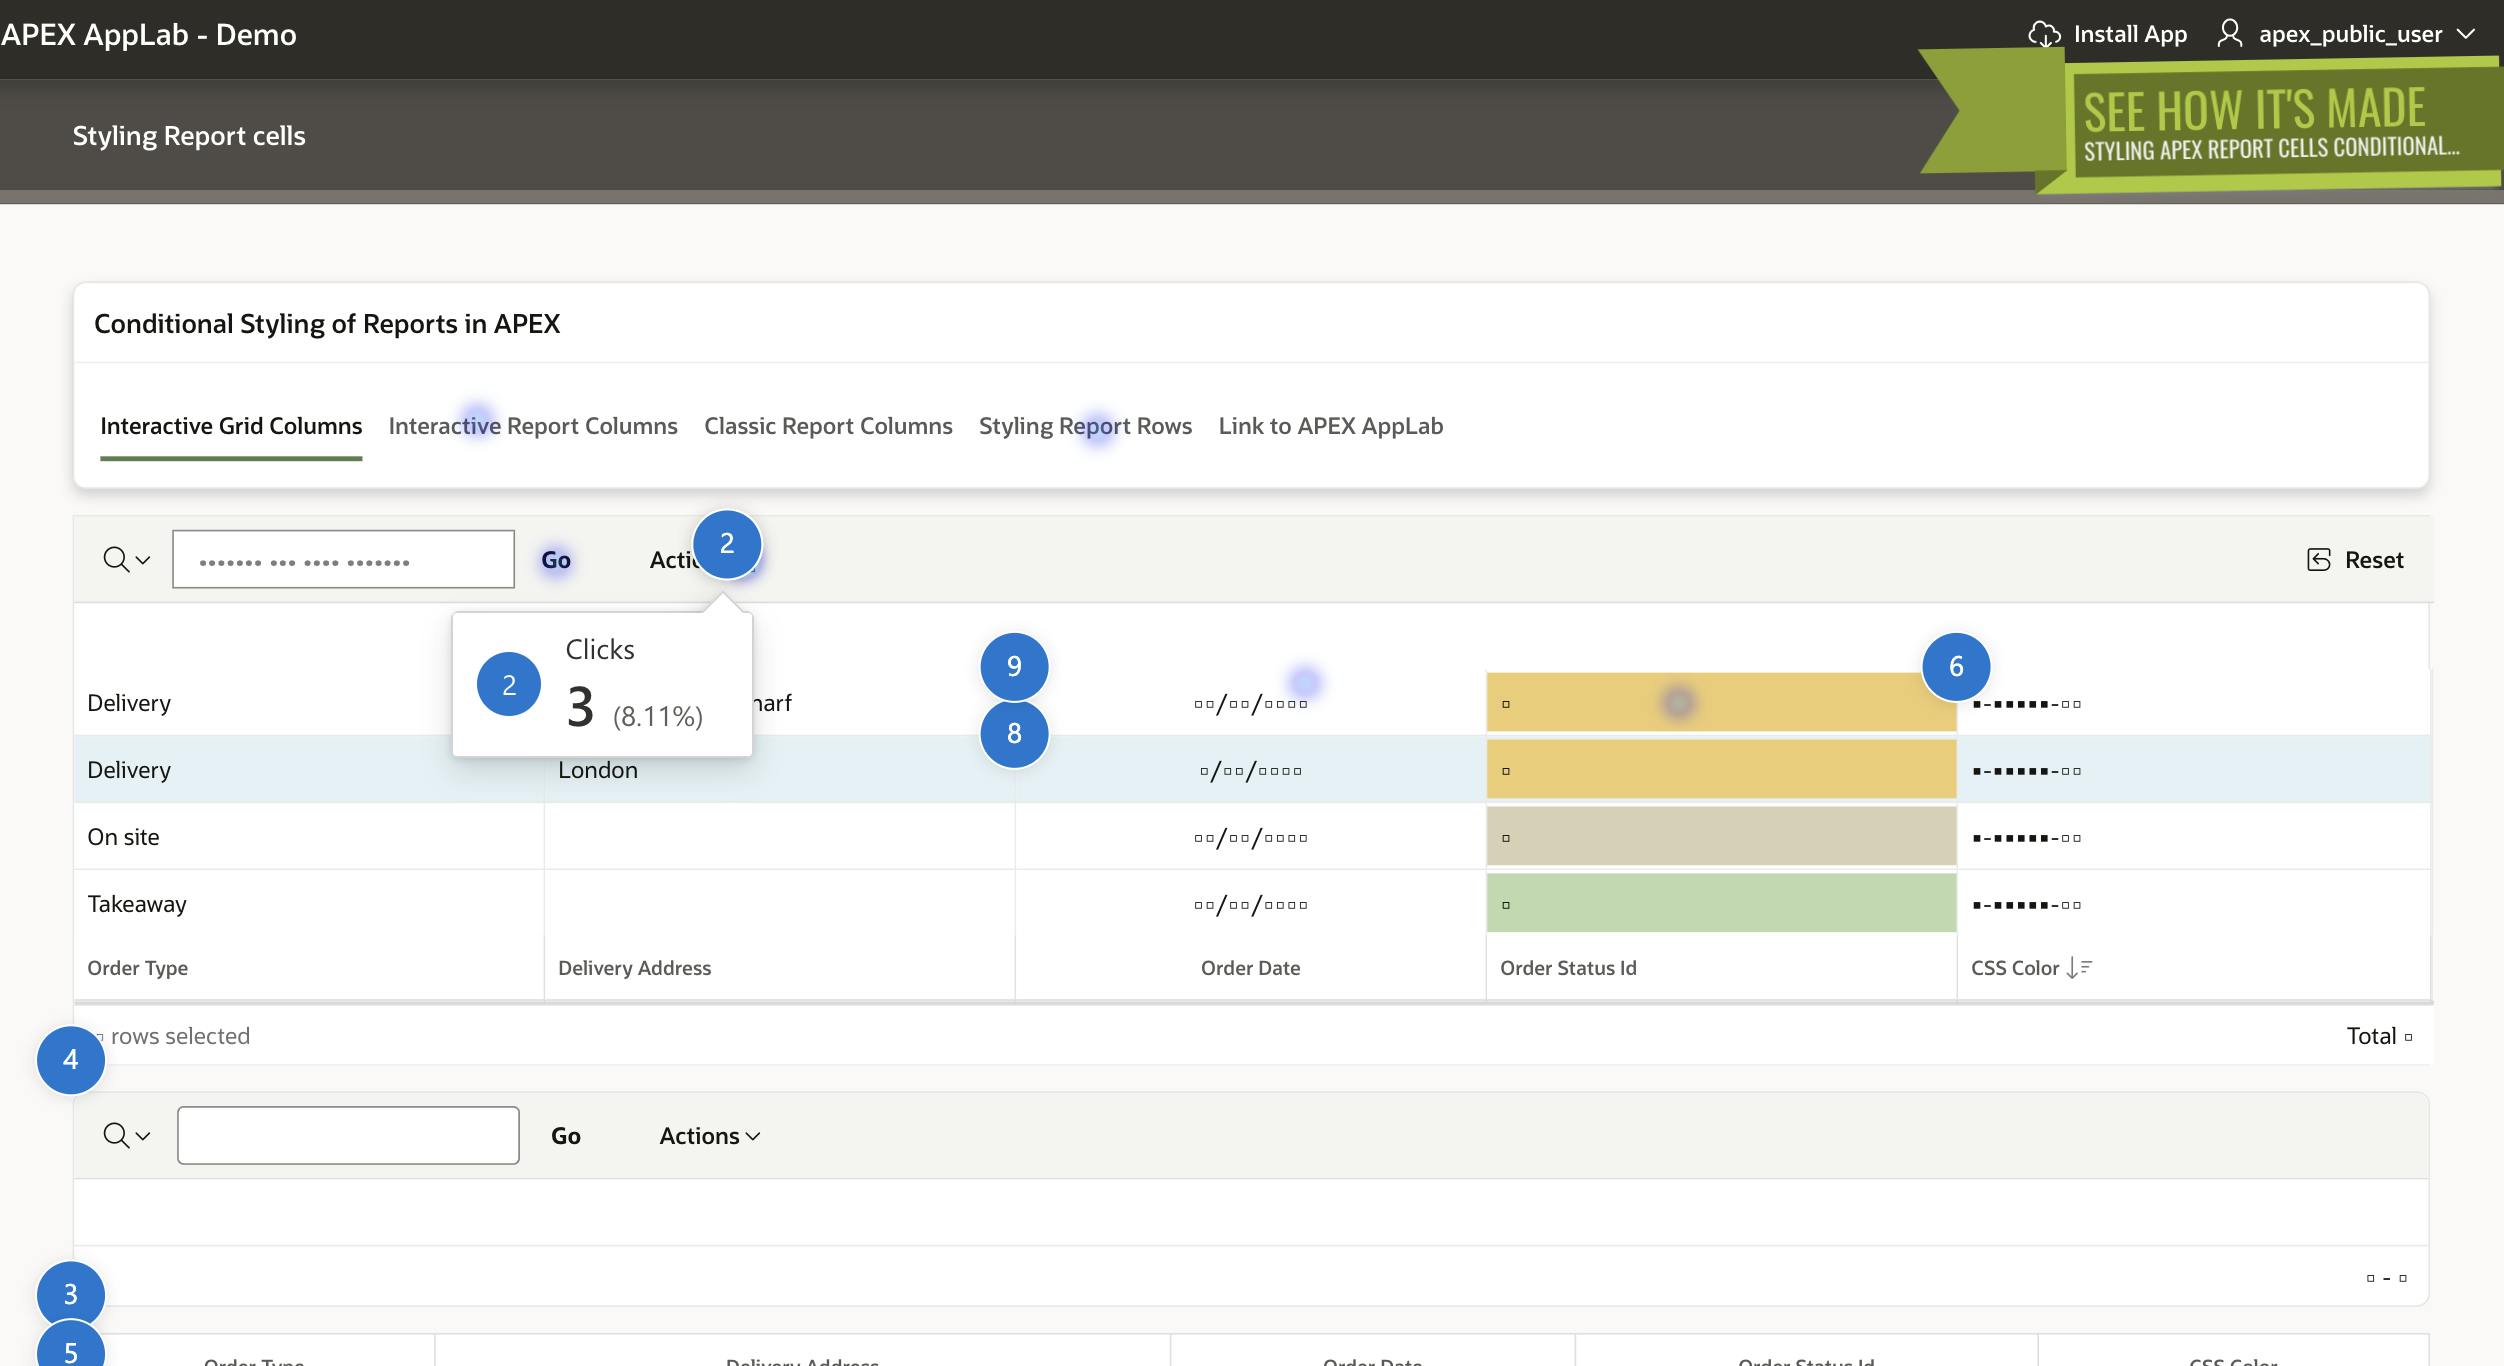
On pages that have lots of content and can be scrolled, this can give you an indication of how often users reach certain place such as the footer information.
Probably the best feature that shows which areas have been used the most. The tool is smart enough to auto-detect important regions on your page, but you can also define them yourself.
Settings
Microsoft Clarity offers many settings you can play around with. Some of them are setting up a team, so you can work on the same project together. Integration with Google Analytics. Masking the user data. Block certain IPs from being included in Clarity. Data insights using AI and so on.
Masking
There are three options available - Strict, Balanced and Relaxed. You can also manually specify particular CSS classes which will be masked. An example will be adding a CSS class named mask_this which is then added to the regions in your application that you want to be masked by Clarity.

Copilot
Copilot helps you make sense of user behaviour on your website.
Ask questions on Clarity data to get simple summaries
Get concise takeaways on session recordings
Ask questions on your Google Analytics data to discover trends
Dashboard
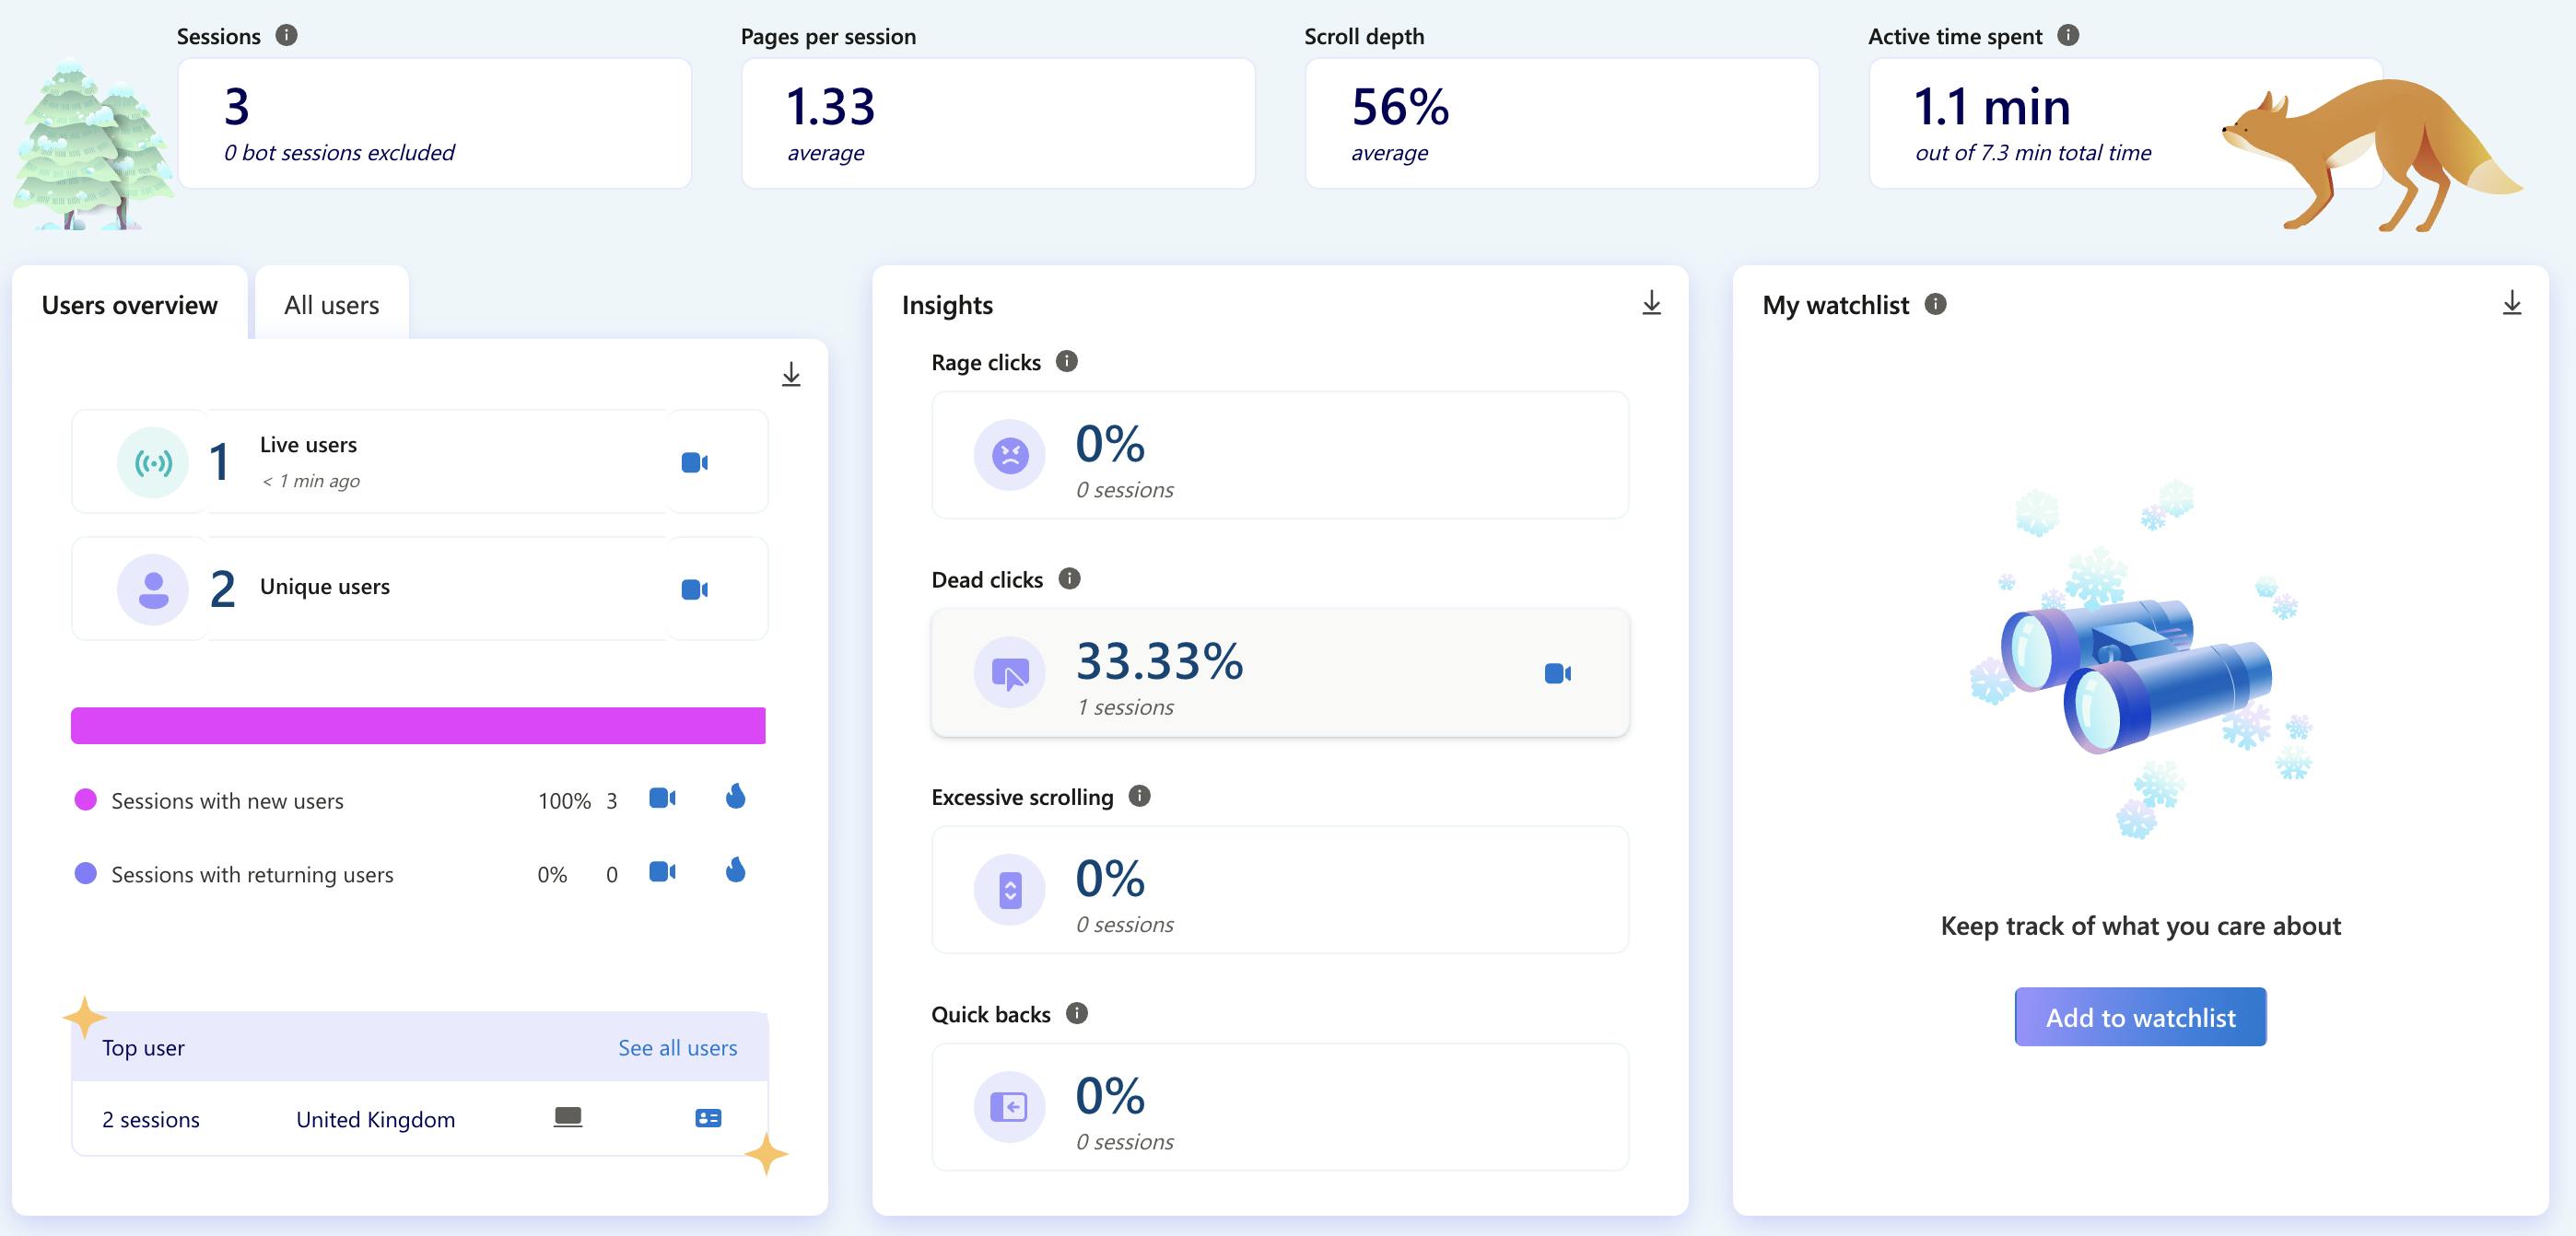
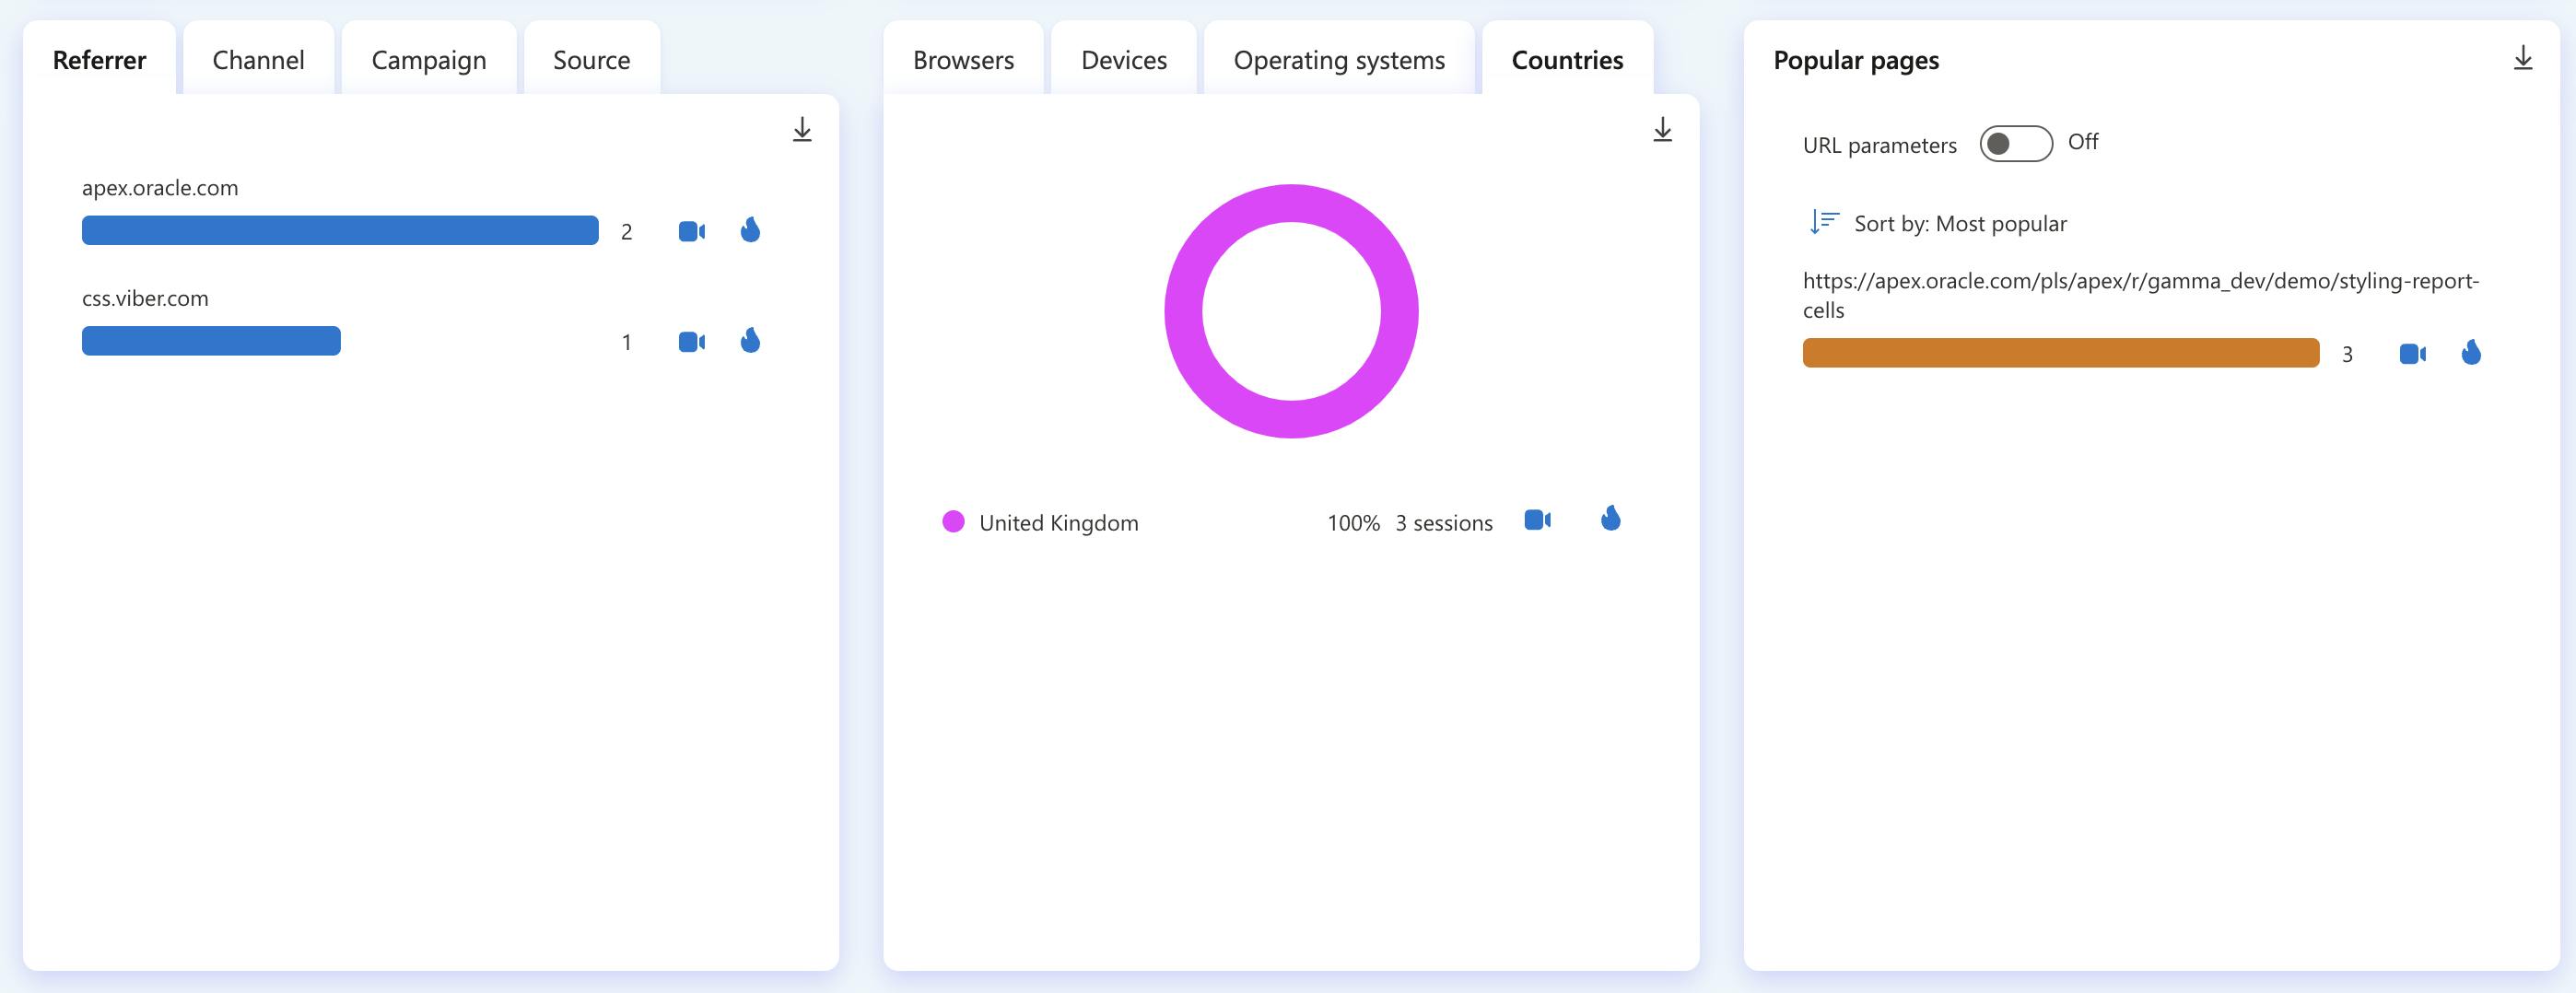
Check these screenshots to get an idea of what the Dashboard looks like. Lots of information on it. You can get a rather good image of who and how is using your application. Best of all - it knows when they hit an error and shows you a recording of the user action that led to it.w
Why use it?
User Behavior Insights: Clarity provides detailed heatmaps, session recordings, and click tracking. By understanding how users interact with your website, you can optimize design, layout, and content placement.
Identify Pain Points: Discover where users drop off, encounter errors, or struggle with navigation. Fixing these pain points can lead to better user experiences and increased conversions.
Conversion Rate Optimization: Clarity helps you analyze user journeys, identify bottlenecks, and improve conversion rates. Whether it’s form submissions, sign-ups, or purchases, you can fine-tune your site for better results.
Content Effectiveness: Evaluate which parts of your content engage users the most. Are they reading your blog posts, watching videos, or clicking on product descriptions? Clarity reveals content performance.
Free and Easy: Clarity is free forever, making it accessible to businesses of all sizes. Plus, it integrates seamlessly with other analytics tools, allowing you to combine insights for a holistic view of your website’s performance. 📊 🔍
Security and Data Privacy
As this tool collects users' interaction with your application or website, there are reasonable questions about Data Privacy and GDPR compliance. Here is what the FAQ of Microsoft Clarity says about that:
Is Clarity GDPR and California Consumer Privacy Act (CCPA) compliant?
Clarity is GDPR-compliant as a data controller. Clarity also processes data in compliance with the CCPA.
What data does Clarity collect?
Clarity captures the user interactions on your website such as, how the page is rendered, and user interactions such as mouse movements, clicks, scrolls, and so on. The code to capture this information is open source and available on GitHub. You can also read a summary of what data fields we collect. You can choose to mask your users' data.
📣 https://learn.microsoft.com/en-us/clarity/faq
Try it
Do you want to try it - no problem! Here is a link to a live Demo:
💻 https://clarity.microsoft.com/demo/projects/view/3t0wlogvdz/dashboard
Follow me
Did you like this blog post?
Follow me! 🔔

