Getting started with Oracle Property Graph in APEX
Creating apps built with ❤️ using Oracle APEX. PL/SQL dev. Exploring the AI and ML world. Keen on front-end, visual arts and new technologies. Love travel, sports, photography.
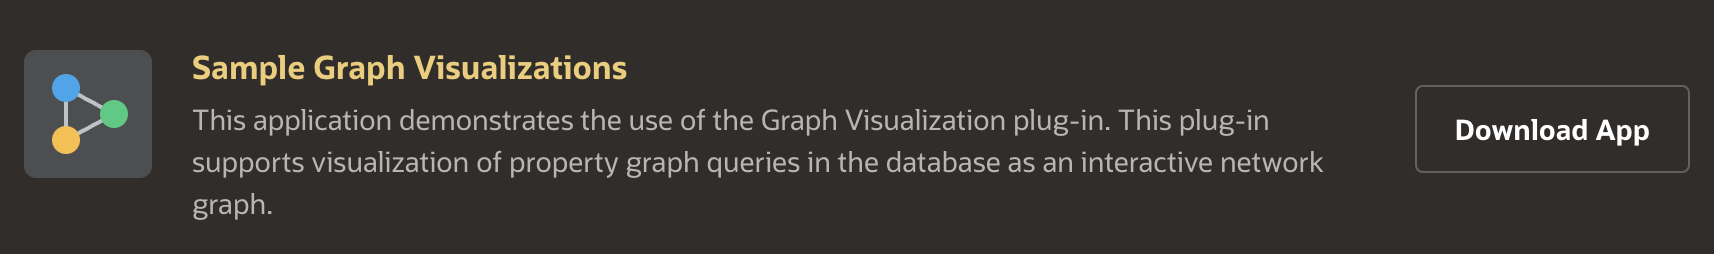
Have you heard the news - Oracle Property Graph is coming to APEX! You can now test out some of the capabilities by downloading and running the "Sample Graph Visualisations" application at https://oracle.github.io/apex/.
It includes a plugin that is free to use. Just in time for me to put it to the test with my Demo application, which enables me to never forget a birthday again. Part of this app shows the relations in my friends' circle and their belonging to different groups that I have defined. And a graph is the ideal visual representation of this type of data.
Let's take a look at how I used it, what additional uses there are for property graphs, and how to get started with property graphs on Oracle APEX.
What is a Property Graph?
A property graph consists of a set of objects or vertices and a set of arrows or edges connecting the objects. Vertices and edges can have multiple properties, which are represented as key-value pairs.
Each vertex has a unique identifier and can have:
A set of outgoing edges
A set of incoming edges
A collection of properties
Each edge has a unique identifier and can have:
An outgoing vertex
An incoming vertex
A text label that describes the relationship between the two vertices
A collection of properties
For vertices and edges, each property is identified with a unique name.
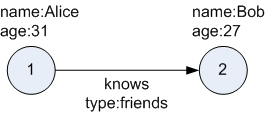
The following figure illustrates a very simple property graph with two vertices and one edge. The two vertices have identifiers 1 and 2. Both vertices have properties name and age. The edge is from the outgoing vertex 1 to the incoming vertex 2. The edge has a text label knows and a property type identifying the type of relationship between vertices 1 and 2.
https://docs.oracle.com/en/database/oracle/property-graph/23.3/index.html
Popular use cases
Fraud Detection
Money Laundering Prevention
Product Recommendations
Social Networks
Supply Chain Mapping
360 Customer View
My use case
My objects:
PersonGroup(a person can belong to multiple groups)Relation(a person can have multiple relations with multiple other people)
My goals:
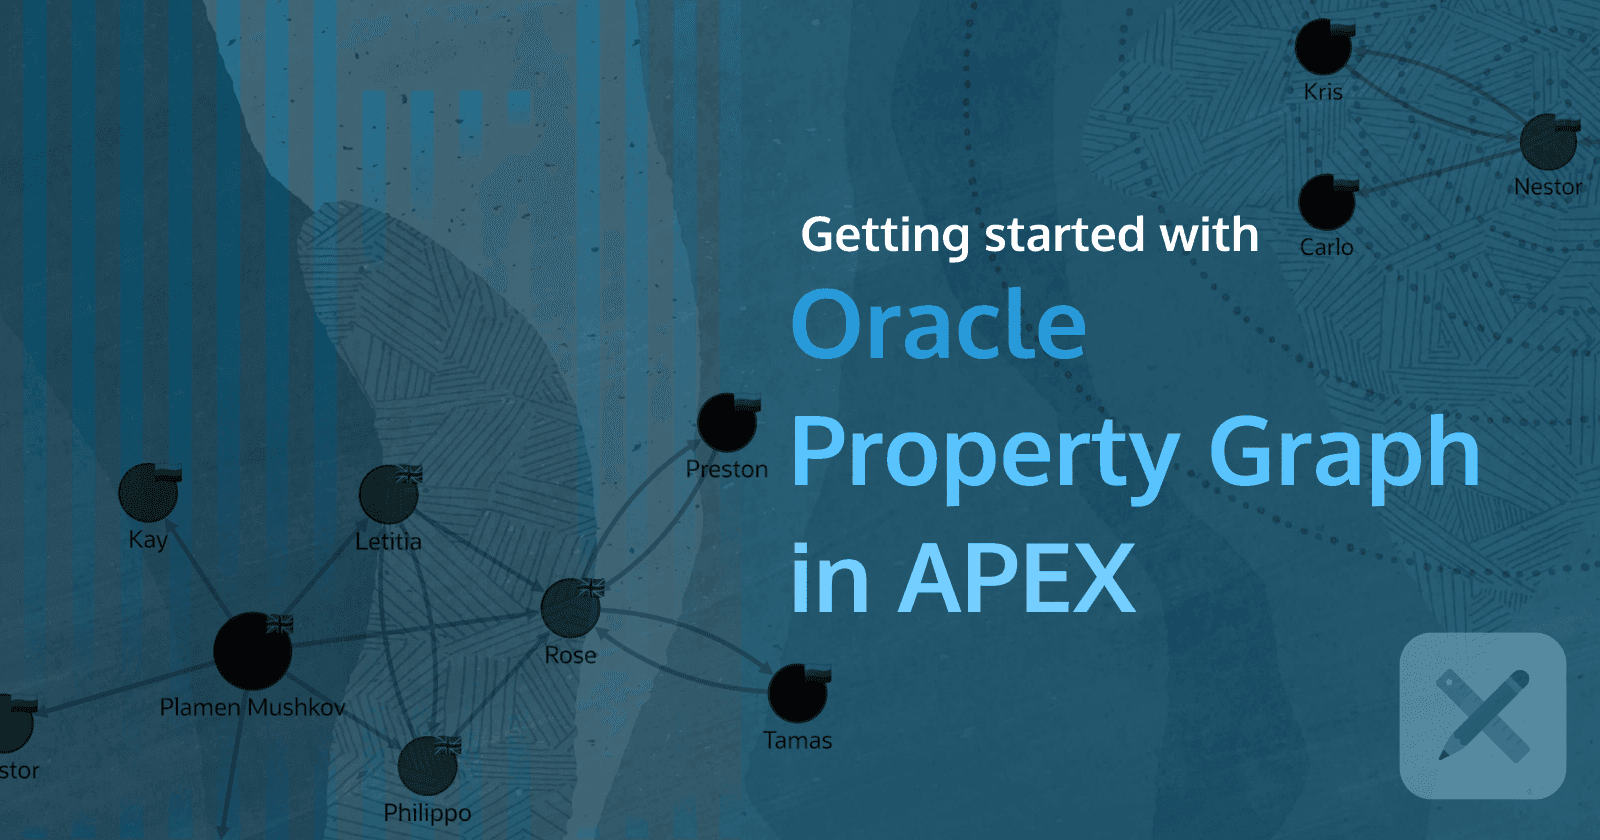
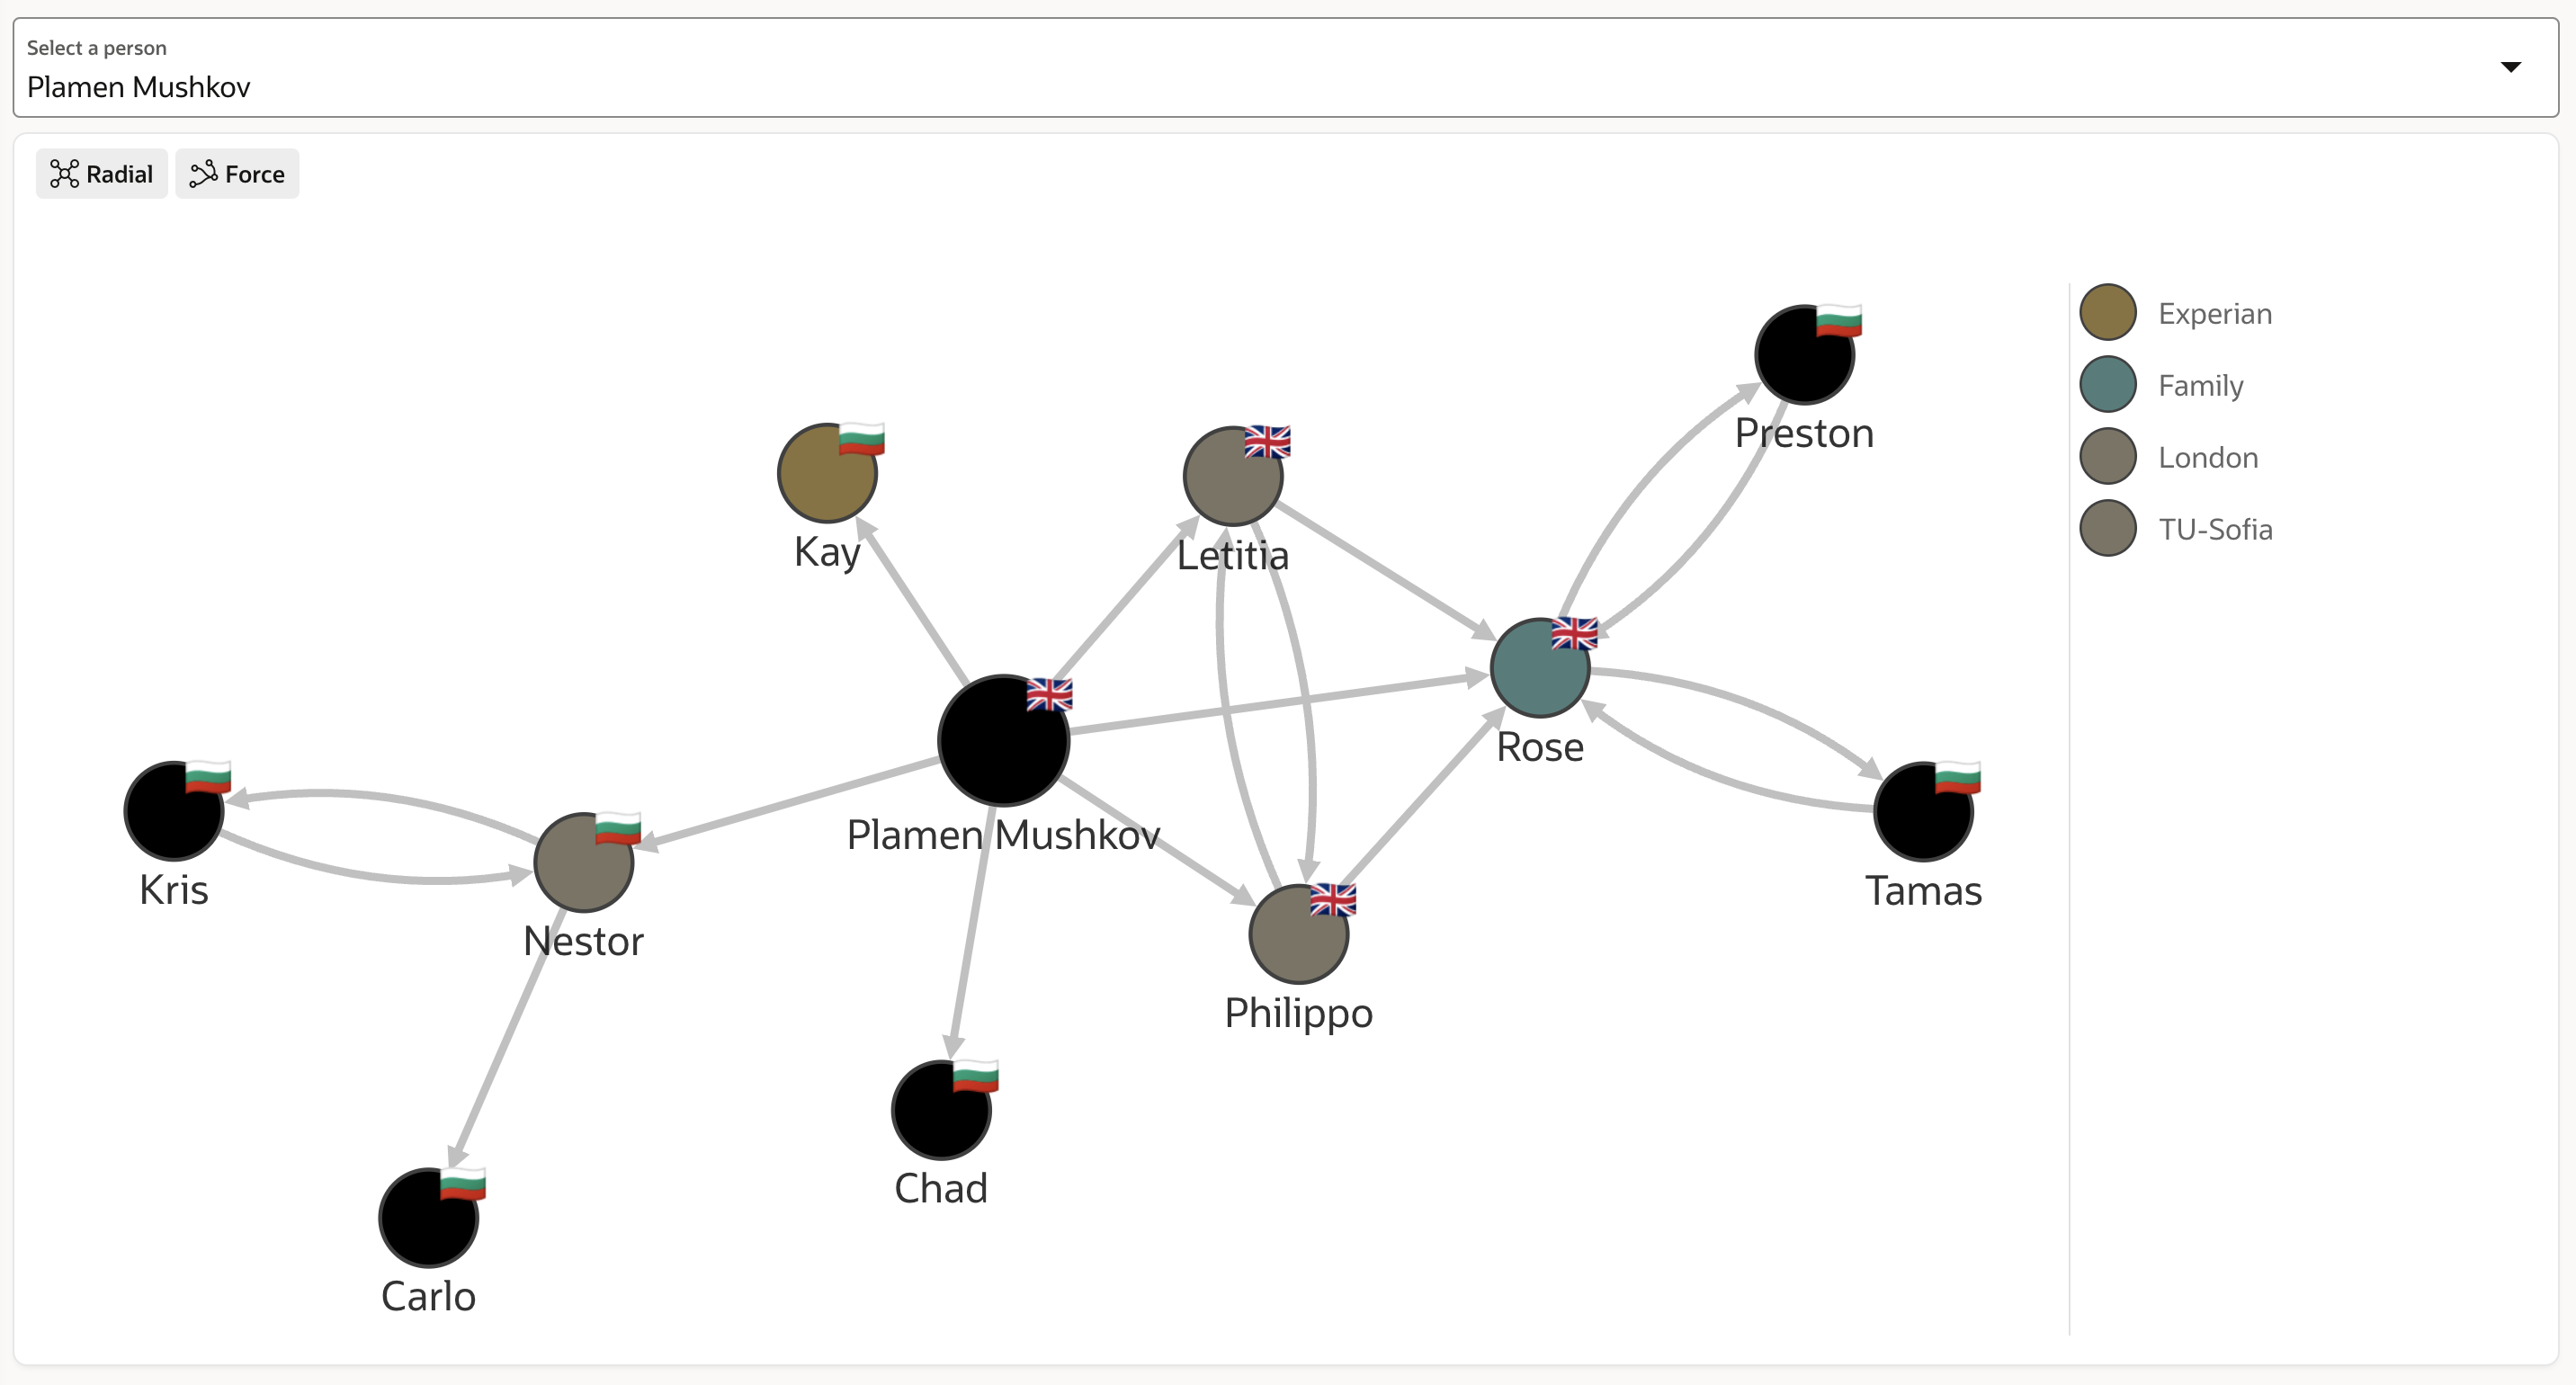
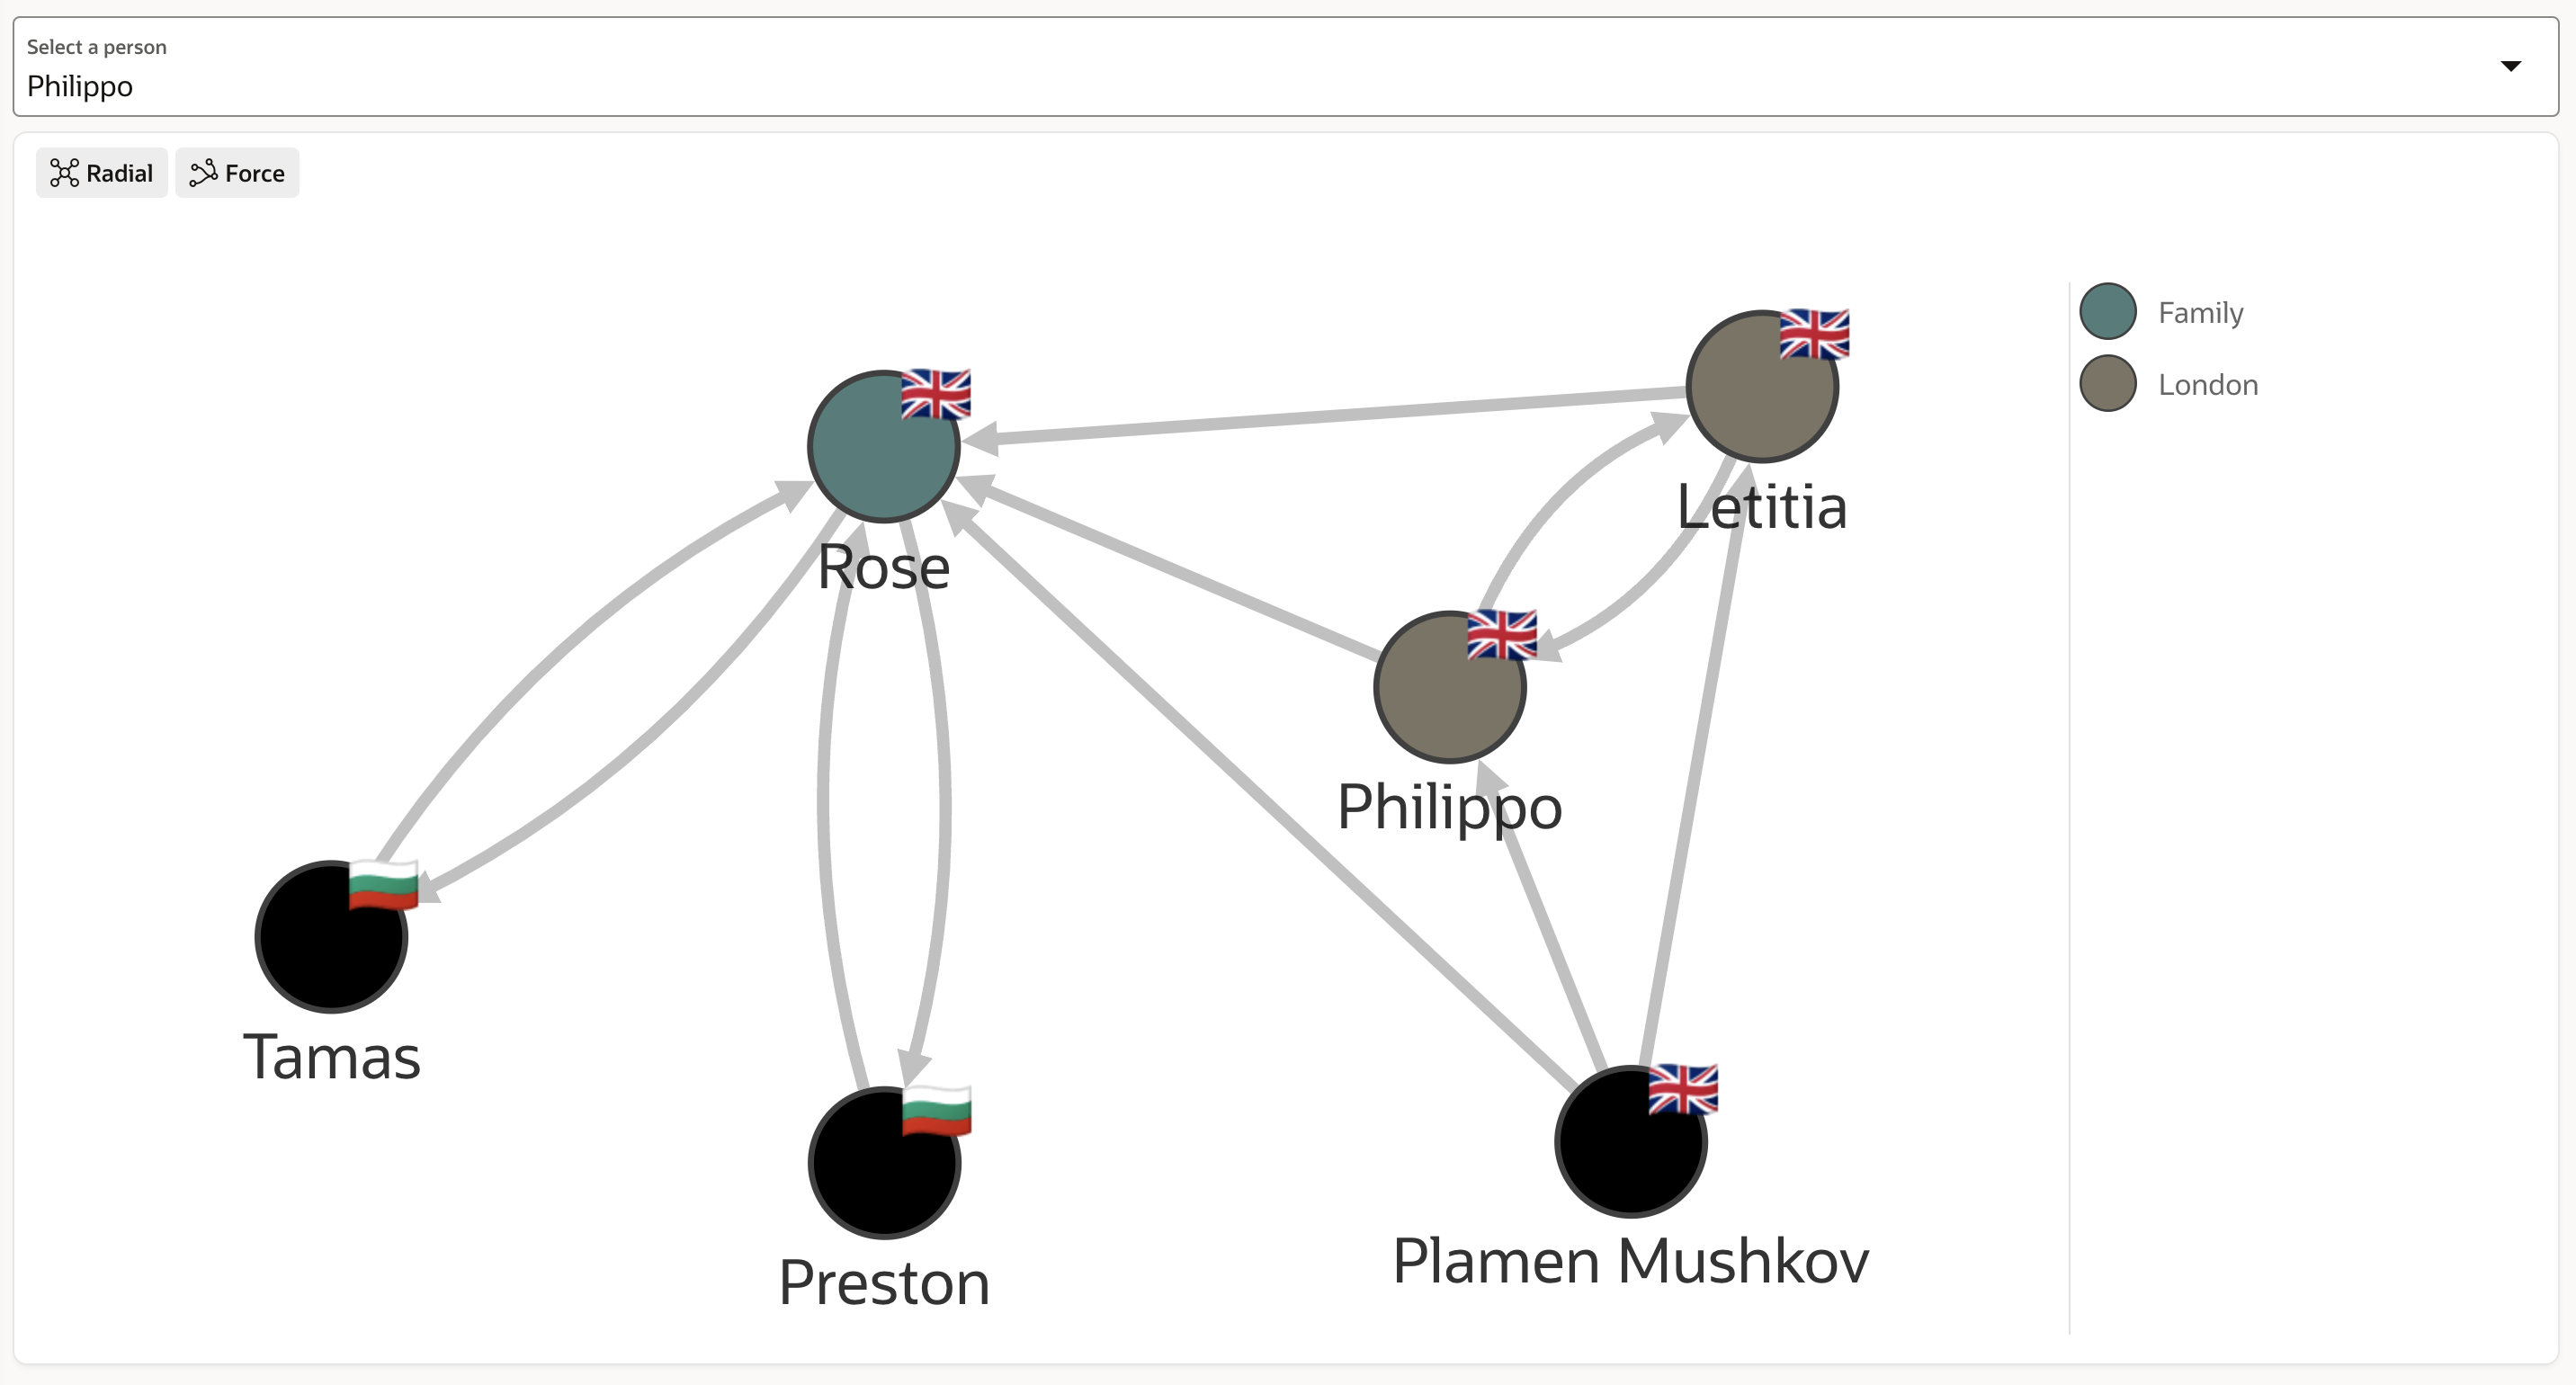
- Display a Graph representation of any person's relations - 2 levels deep. What it means is that I want to see not only my 1st level connections but their 1st level connections too. See the example below:

In this example, we see
Plamen Mushkov's 1st connection -Nestor, but alsoKrisandCarlo, who are 1st connections toNestor.
Being able to filter the Graph and select the main
vertex- in this casePlamen MushkovBeing able to filter the graph on a particular group to which people belong
Being able to display information about a
vertex(person) and anedge(relation).
Result:
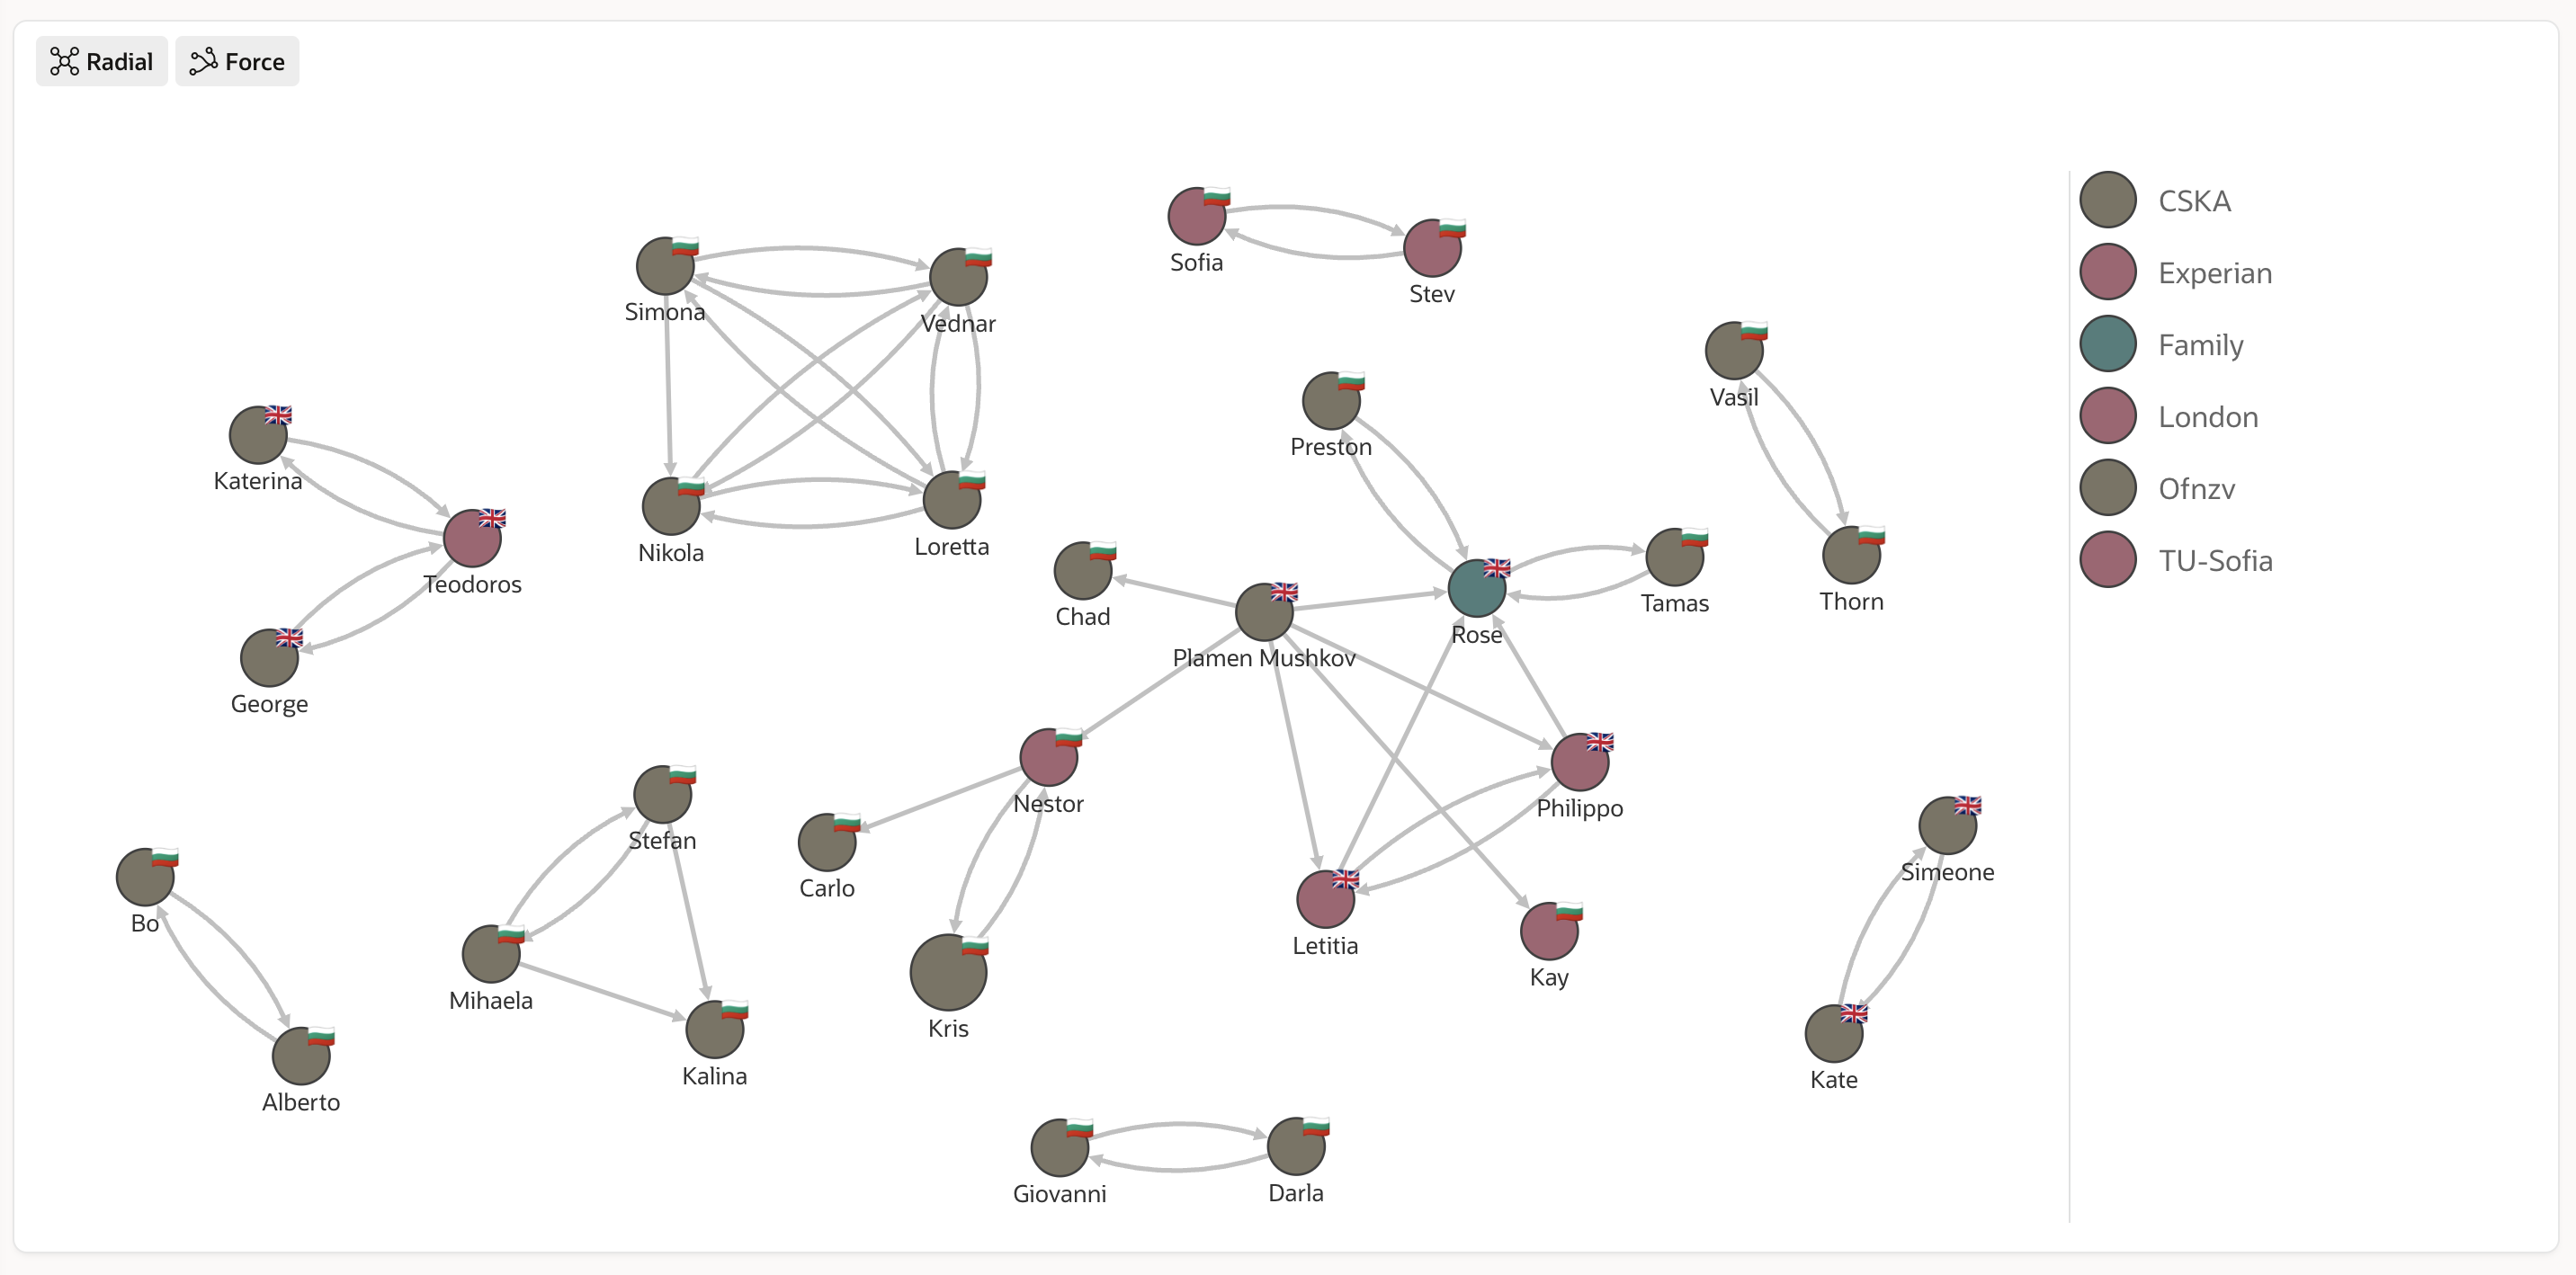
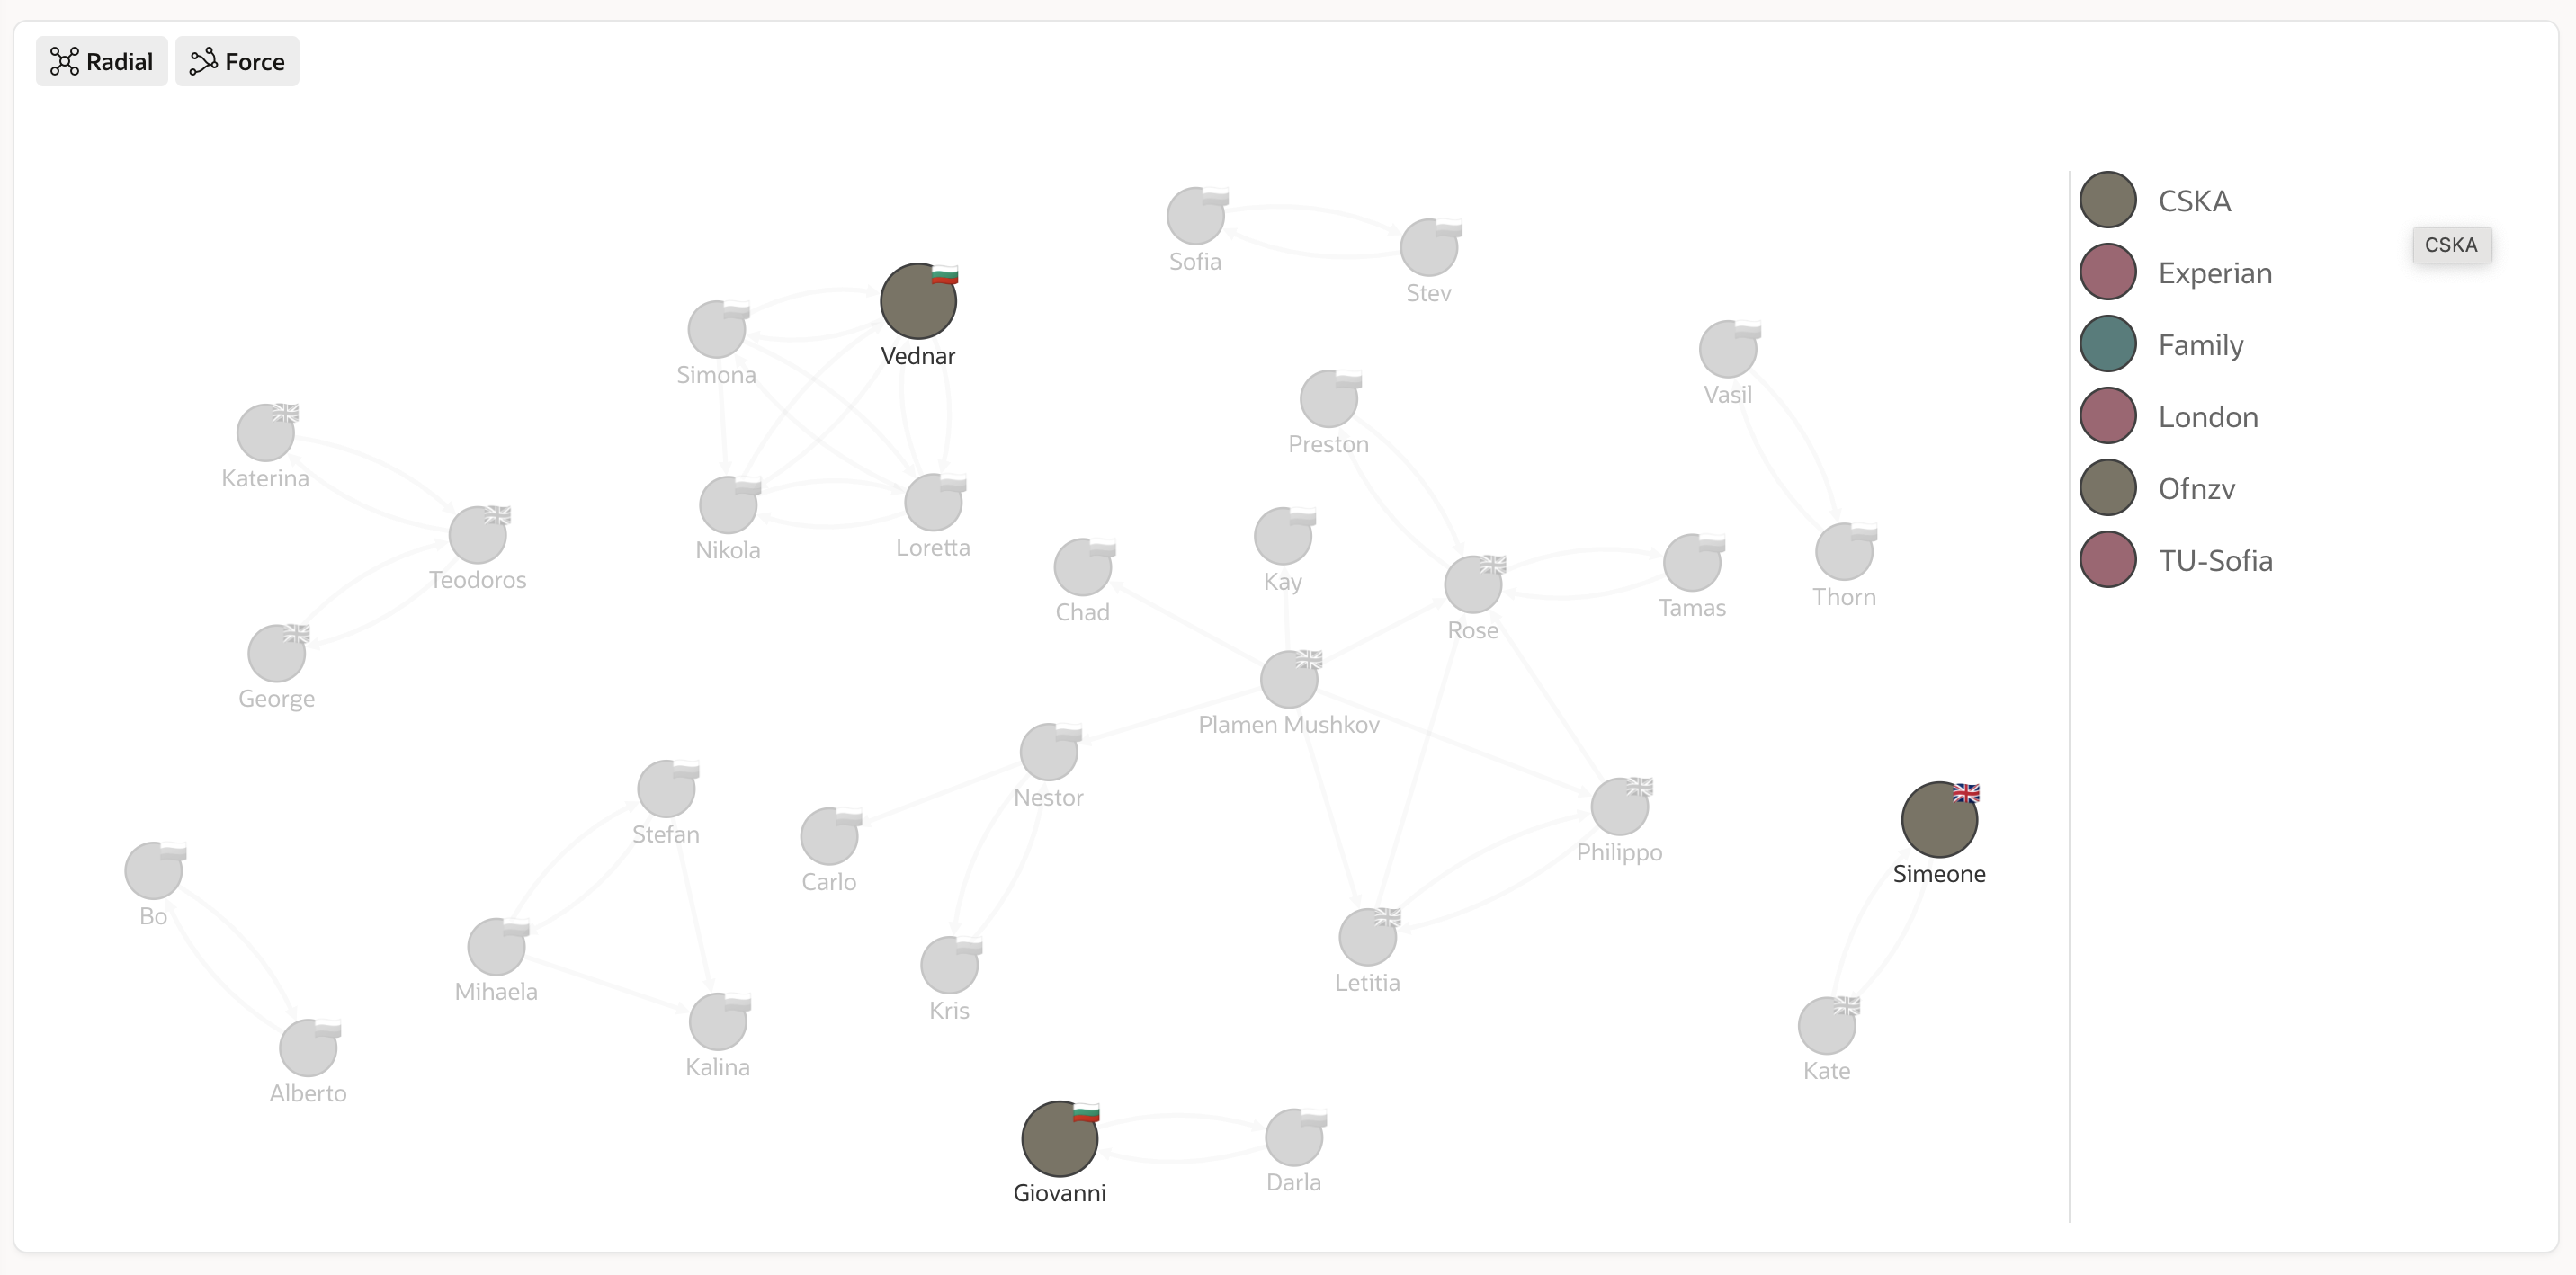
A Relationships Property Graph displaying all people with their relations
A Relationships Property Graph for a selected person
Using the APEX plugin
To get the above result, I used the APEX "Graph Visualization (Preview)" plugin. After installing it, the first step is to create a new region and select the plugin as a Region Type.
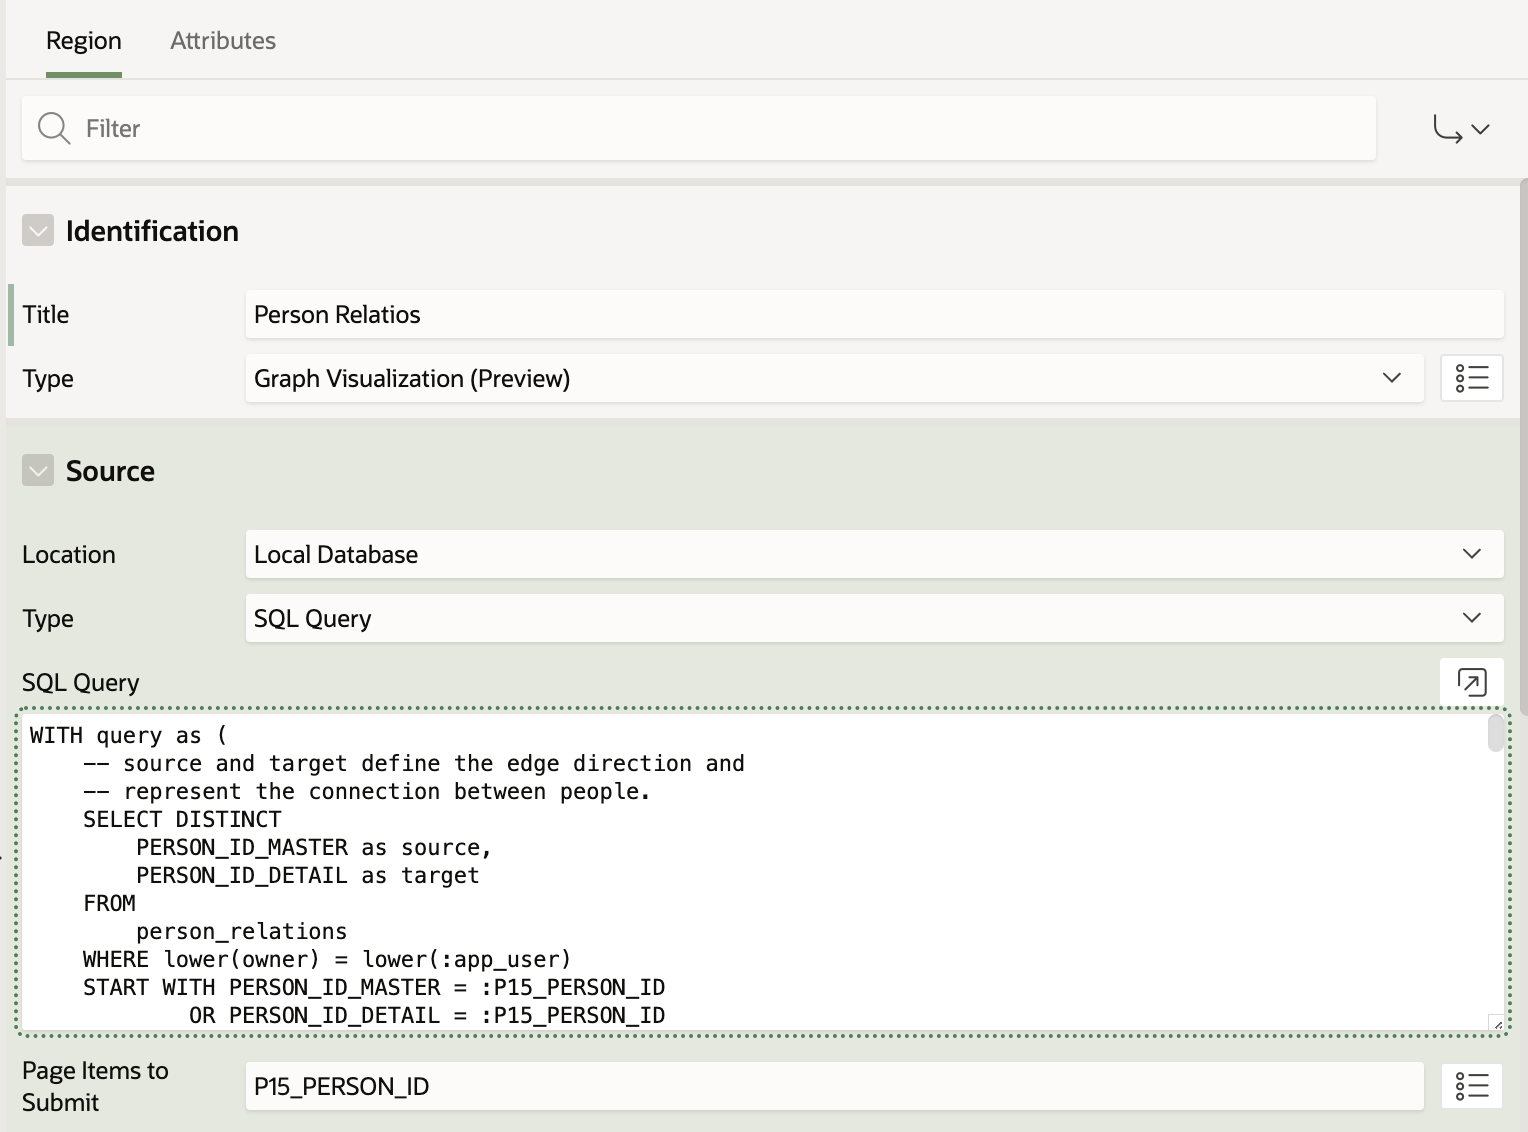
Query:
The most important part of it is the SQL query. This query generates a JSON, which is powering the plugin with data. Let's take a look at the query, generating the last Graph and the JSON output of it:
WITH query as (
    -- source and target define the edge direction and
    -- represent the connection between people.
    SELECT DISTINCT
        PERSON_ID_MASTER as source,
        PERSON_ID_DETAIL as target
    FROM
        person_relations
    WHERE lower(owner) = lower(:app_user)
    START WITH PERSON_ID_MASTER = :P15_PERSON_ID
            OR PERSON_ID_DETAIL = :P15_PERSON_ID
    CONNECT BY nocycle PRIOR PERSON_ID_MASTER = PERSON_ID_DETAIL
                   OR  PRIOR PERSON_ID_DETAIL = PERSON_ID_MASTER
)
,page AS (
    SELECT * FROM query
    ORDER BY source
)
,vertices AS (
    -- fetch person and relation details and construct JSON
    SELECT
        JSON_OBJECT(
            'id' VALUE p.PERSON_ID,
            'properties' VALUE JSON_OBJECT(
                'FullName' VALUE p.FULL_NAME,
                'Nickname' VALUE p.NICKNAME,
                'DisplayName' VALUE nvl(p.NICKNAME, p.FULL_NAME),
                'Country' VALUE ce.ISO,
                'CountryFlag' VALUE ce.EMOJI,
                'City' VALUE p.CITY,
                'GroupId' VALUE g.GROUP_ID,
                'GroupName' VALUE g.GROUP_NAME,
                'Relation' VALUE rt.RELATION_NAME
            )
        ) AS vertex
    FROM persons p
     LEFT OUTER JOIN persons_groups pg ON p.PERSON_ID = pg.PERSON_ID
     LEFT OUTER JOIN groups g ON pg.GROUP_ID = g.GROUP_ID
     LEFT OUTER JOIN person_relations pr ON p.PERSON_ID = pr.PERSON_ID_DETAIL
     LEFT OUTER JOIN relation_types rt ON pr.RELATION_ID = rt.RELATION_ID
     LEFT OUTER JOIN countries ce ON ce.name = p.COUNTRY
    WHERE
        p.PERSON_ID in ( SELECT source from page ) or
        p.PERSON_ID in ( SELECT target from page )
),
edges AS (
    -- source (person) and target (person) define the directed edge
    SELECT
        JSON_OBJECT('source' VALUE source, 'target' VALUE target) AS edge
    FROM
        page
)
SELECT
    -- construct the final JSON that GVT accepts.
    JSON_OBJECT(
        'vertices' VALUE (
            SELECT JSON_ARRAYAGG(vertex returning clob)
            FROM vertices ),
        'edges' VALUE (
            SELECT JSON_ARRAYAGG(edge returning clob)
            FROM edges ),
        'numResults' VALUE (
            SELECT COUNT(*)
            FROM query )
      returning clob
    ) json
FROM DUAL;
and the JSON result being:
  {
   "vertices":[
      {
         "id":681,
         "properties":{
            "FullName":"Simon",
            "Nickname":"Simon",
            "DisplayName":"Simon",
            "Country":"GB",
            "CountryFlag":"🇬🇧",
            "City":"London",
            "GroupId":22,
            "GroupName":"London",
            "Relation":"father"
         }
      },
      {
         "id":681,
         "properties":{
            "FullName":"Simeone",
            "Nickname":"Simeone",
            "DisplayName":"Simeone",
            "Country":"GB",
            "CountryFlag":"🇬🇧",
            "City":"London",
            "GroupId":1,
            "GroupName":"CSKA",
            "Relation":"father"
         }
      },
      {
         "id":682,
         "properties":{
            "FullName":"Kate",
            "Nickname":null,
            "DisplayName":"Kate",
            "Country":"GB",
            "CountryFlag":"🇬🇧",
            "City":"London",
            "GroupId":null,
            "GroupName":null,
            "Relation":"daughter"
         }
      }
   ],
   "edges":[
      {
         "source":681,
         "target":682
      },
      {
         "source":682,
         "target":681
      }
   ],
   "numResults":2
}
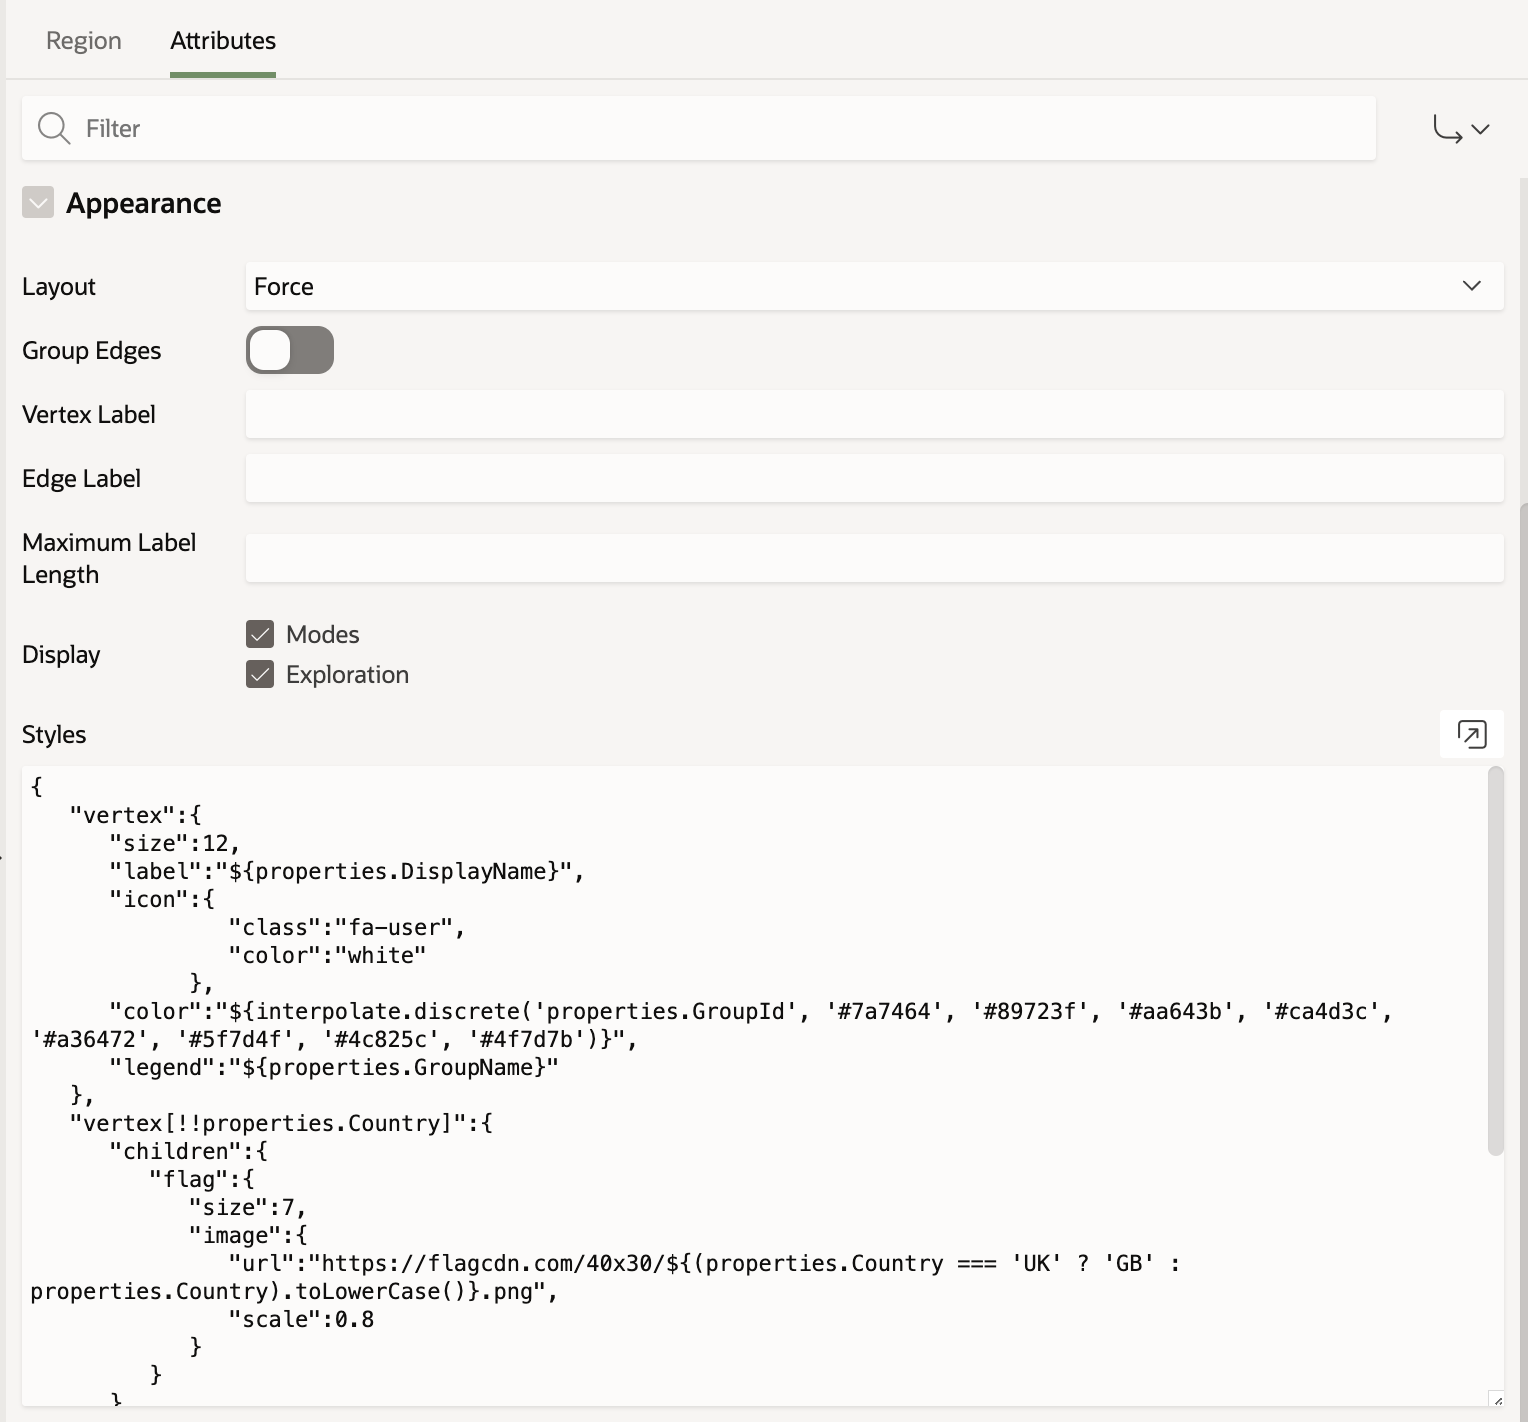
Settings:
To change the visual styles of your region, go to your Region / Attributes / Appearance. Along with some declarative options, you can further modify the final result using the Styles section. Here is an example of what this section looks like in my region:
{
   "vertex":{
      "size":12,
      "label":"${properties.DisplayName}",
      "icon":{
               "class":"fa-user",
               "color":"white"
            },
      "color":"${interpolate.discrete('properties.GroupId', '#7a7464', '#89723f', '#aa643b', '#ca4d3c', '#a36472', '#5f7d4f', '#4c825c', '#4f7d7b')}",
      "legend":"${properties.GroupName}"
   },
   "vertex[!!properties.Country]":{
      "children":{
         "flag":{
            "size":7,
            "image":{
               "url":"https://flagcdn.com/40x30/${(properties.Country === 'UK' ? 'GB' : properties.Country).toLowerCase()}.png",
               "scale":0.8
            }
         }
      }
   }
}
The Styles options should be manually coded right now, and the properties do not always work (like the vertex icon, which sometimes shows and sometimes doesn't). But it also gives you the flexibility to experiment and get different results for your graph. To see other options available, you can visit the following documentation:
https://docs.oracle.com/en/database/oracle/property-graph/23.3/pgjsd/interface.html#styles
In theory, the Icon \ Class property should support Font Awesome icons, together with another set of JET icons, but so far I haven't managed to make them appear. See the list of additional icons below:
https://static.oracle.com/cdn/fnd/gallery/2401.0.2/images/preview/index.html
More information
* The Property Graph is available in Oracle Database 23C. It is also available on the Autonomous Database running 19C, as well as apex.oracle.com
- Get the sample Property Graph APEX application here:
- More about Property Graphs in Oracle
- Oracle Database 23C new features review (scroll down the page to see the "Operational property graphs" section)
- Office Hours sessions, dedicated to Property Graph in APEX
Follow me